
 |
 |
| Northern Hemisphere | Southern Hemisphere |
|---|
|
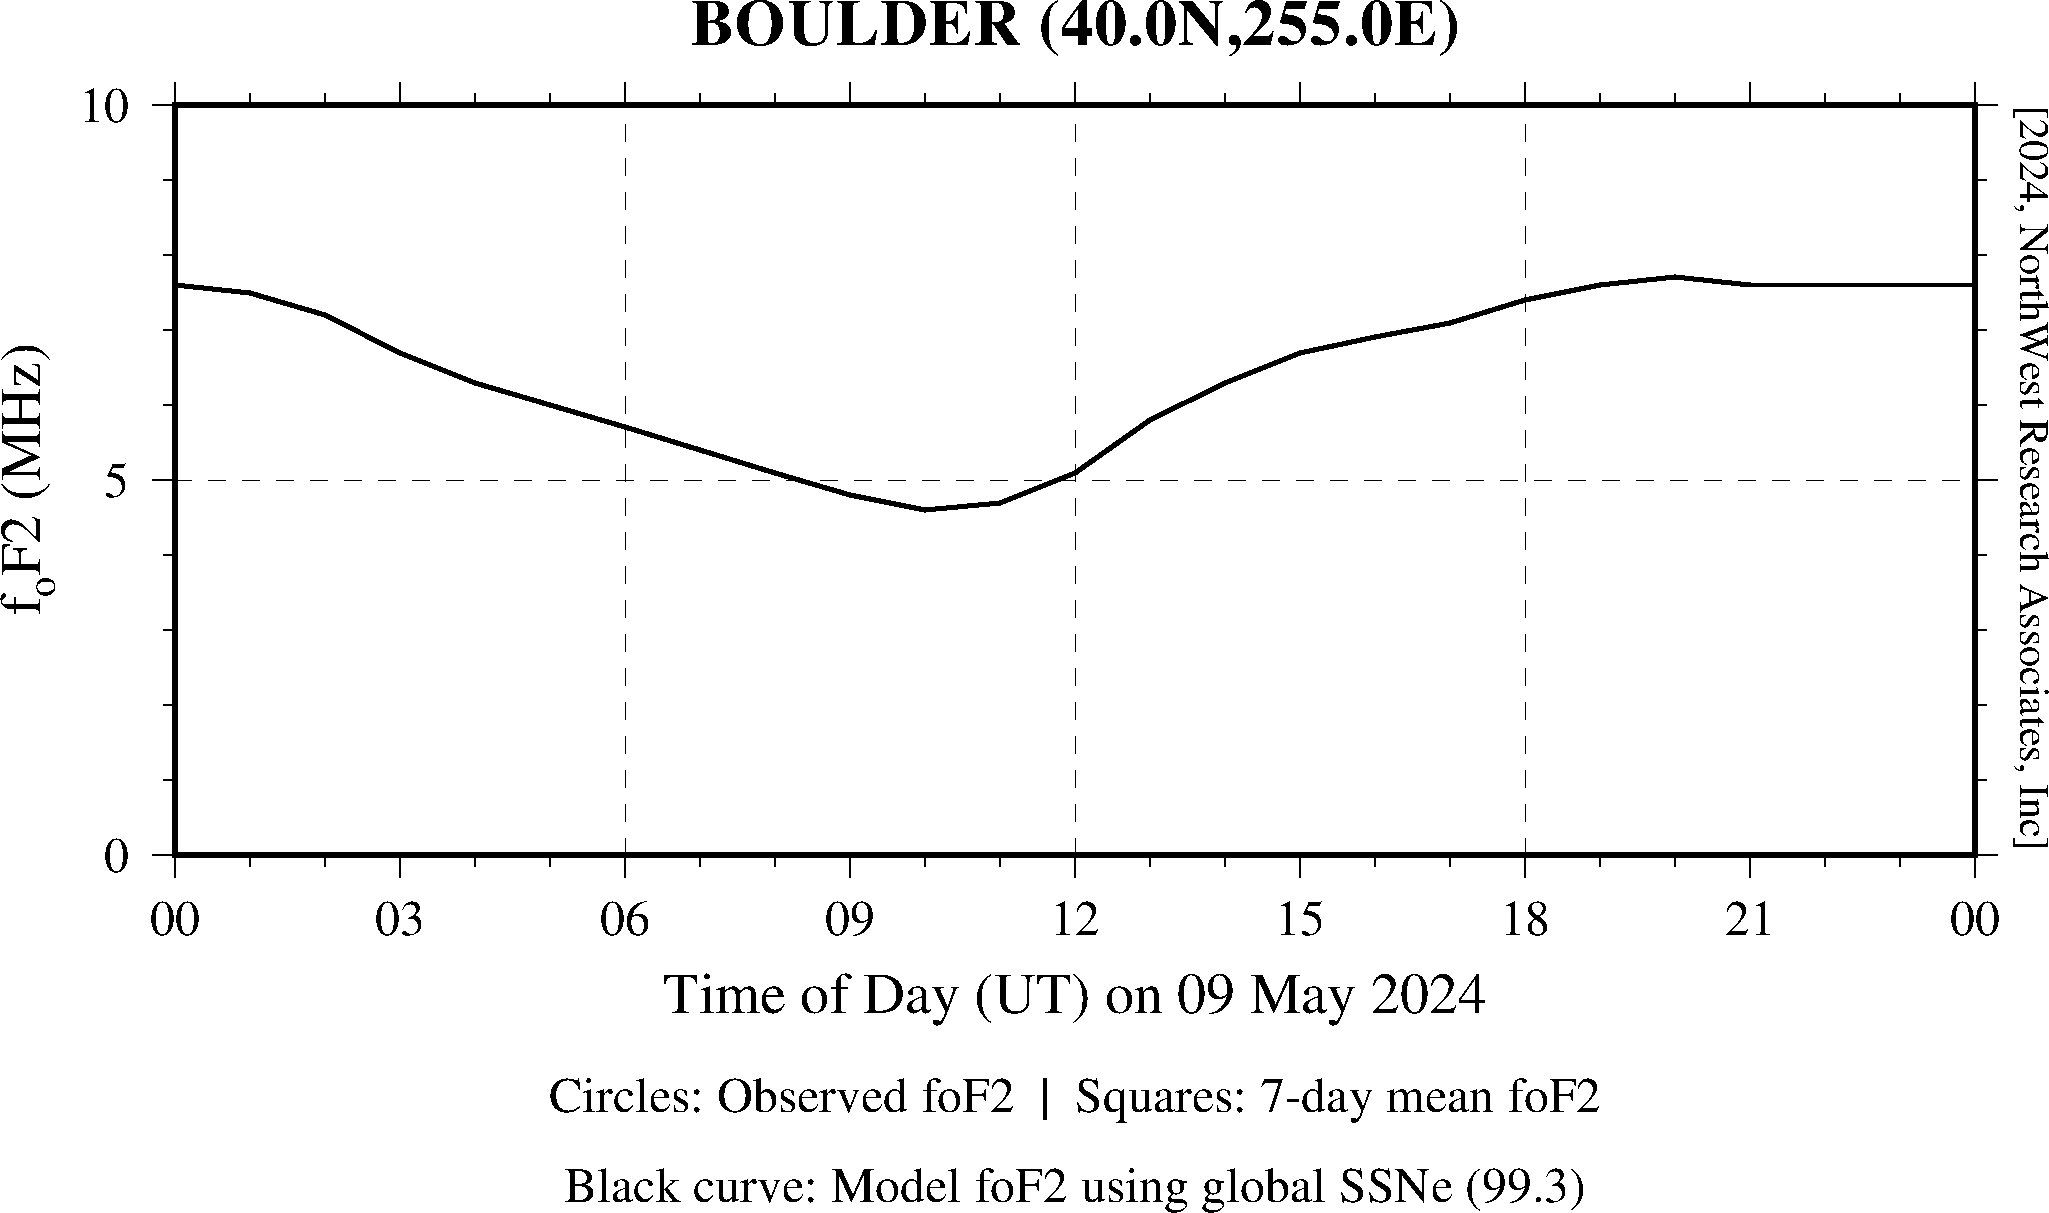
This page links to plots comparing foF2 calculated from the CCIR foF2 model using the effective SSN values to foF2 observations and 7-day means for a variety of stations. The SSNe values were calculated from observations in the geomagnetic latitude range of -50 to +50 degrees. The foF2 parameter shown in these plots, and used in generating the effective SSN index, is defined as the highest frequency which will reflect from the main (F2) layer of the ionosphere on a vertical propagation path. It is measured at a number of locations around the world using an instrument known as an ionosonde. The "o" in foF2 indicates that it is for the "ordinary" propagation mode (as opposed to the extraordinary, or "x", mode). More details on this measurement and on ionosondes can be found at the National Centers for Environmental Information (NCEI) ionospheric WWW site. All plots have the same format as the one shown above. The foF2 observations for the UT day from the station are plotted as + symbols, and the 7-day mean foF2 are plotted as * symbols. The lines are foF2 values calculated from the CCIR foF2 model (the URSI-88 coefficients) using the NWRA global SSNe (black curve), northern-hemisphere SSNe (red curve), and southern-hemisphere SSNe (green curve).
To hourly SSNe24 plot
Comparisons are available for the following stations:
[NOTE: Stations marked with an * were not included in the SSNe
calculation either because they are above the high-latitude cutoff
AKNOWLEDGEMENT: | ||||||||||||||||||||||||||||||||||||||||||||||||||||||||||||||||||||||||||||||||||||||||||||||||||||||||||||||||||||||||||||||||||||||||||||||||||||||||||||||||||||||||||||||||||||||||||||||||||||||||||||||||||||||||||||||||||||||||||||||||||||||||||||||||||||||||||||||||||||||||||||||||||||||||||||||||||||||||||||||||||||||||||||||||||||||||||||||||||||||||||||||||||||||||||||||||||||||||||||||||||||||||||||||||||||||||||||||||||||||||||||

Copyright © 1996-2024 NorthWest Research Associates, Inc. All rights reserved.