
Current forecast | One rotation back | Two rotations back
|
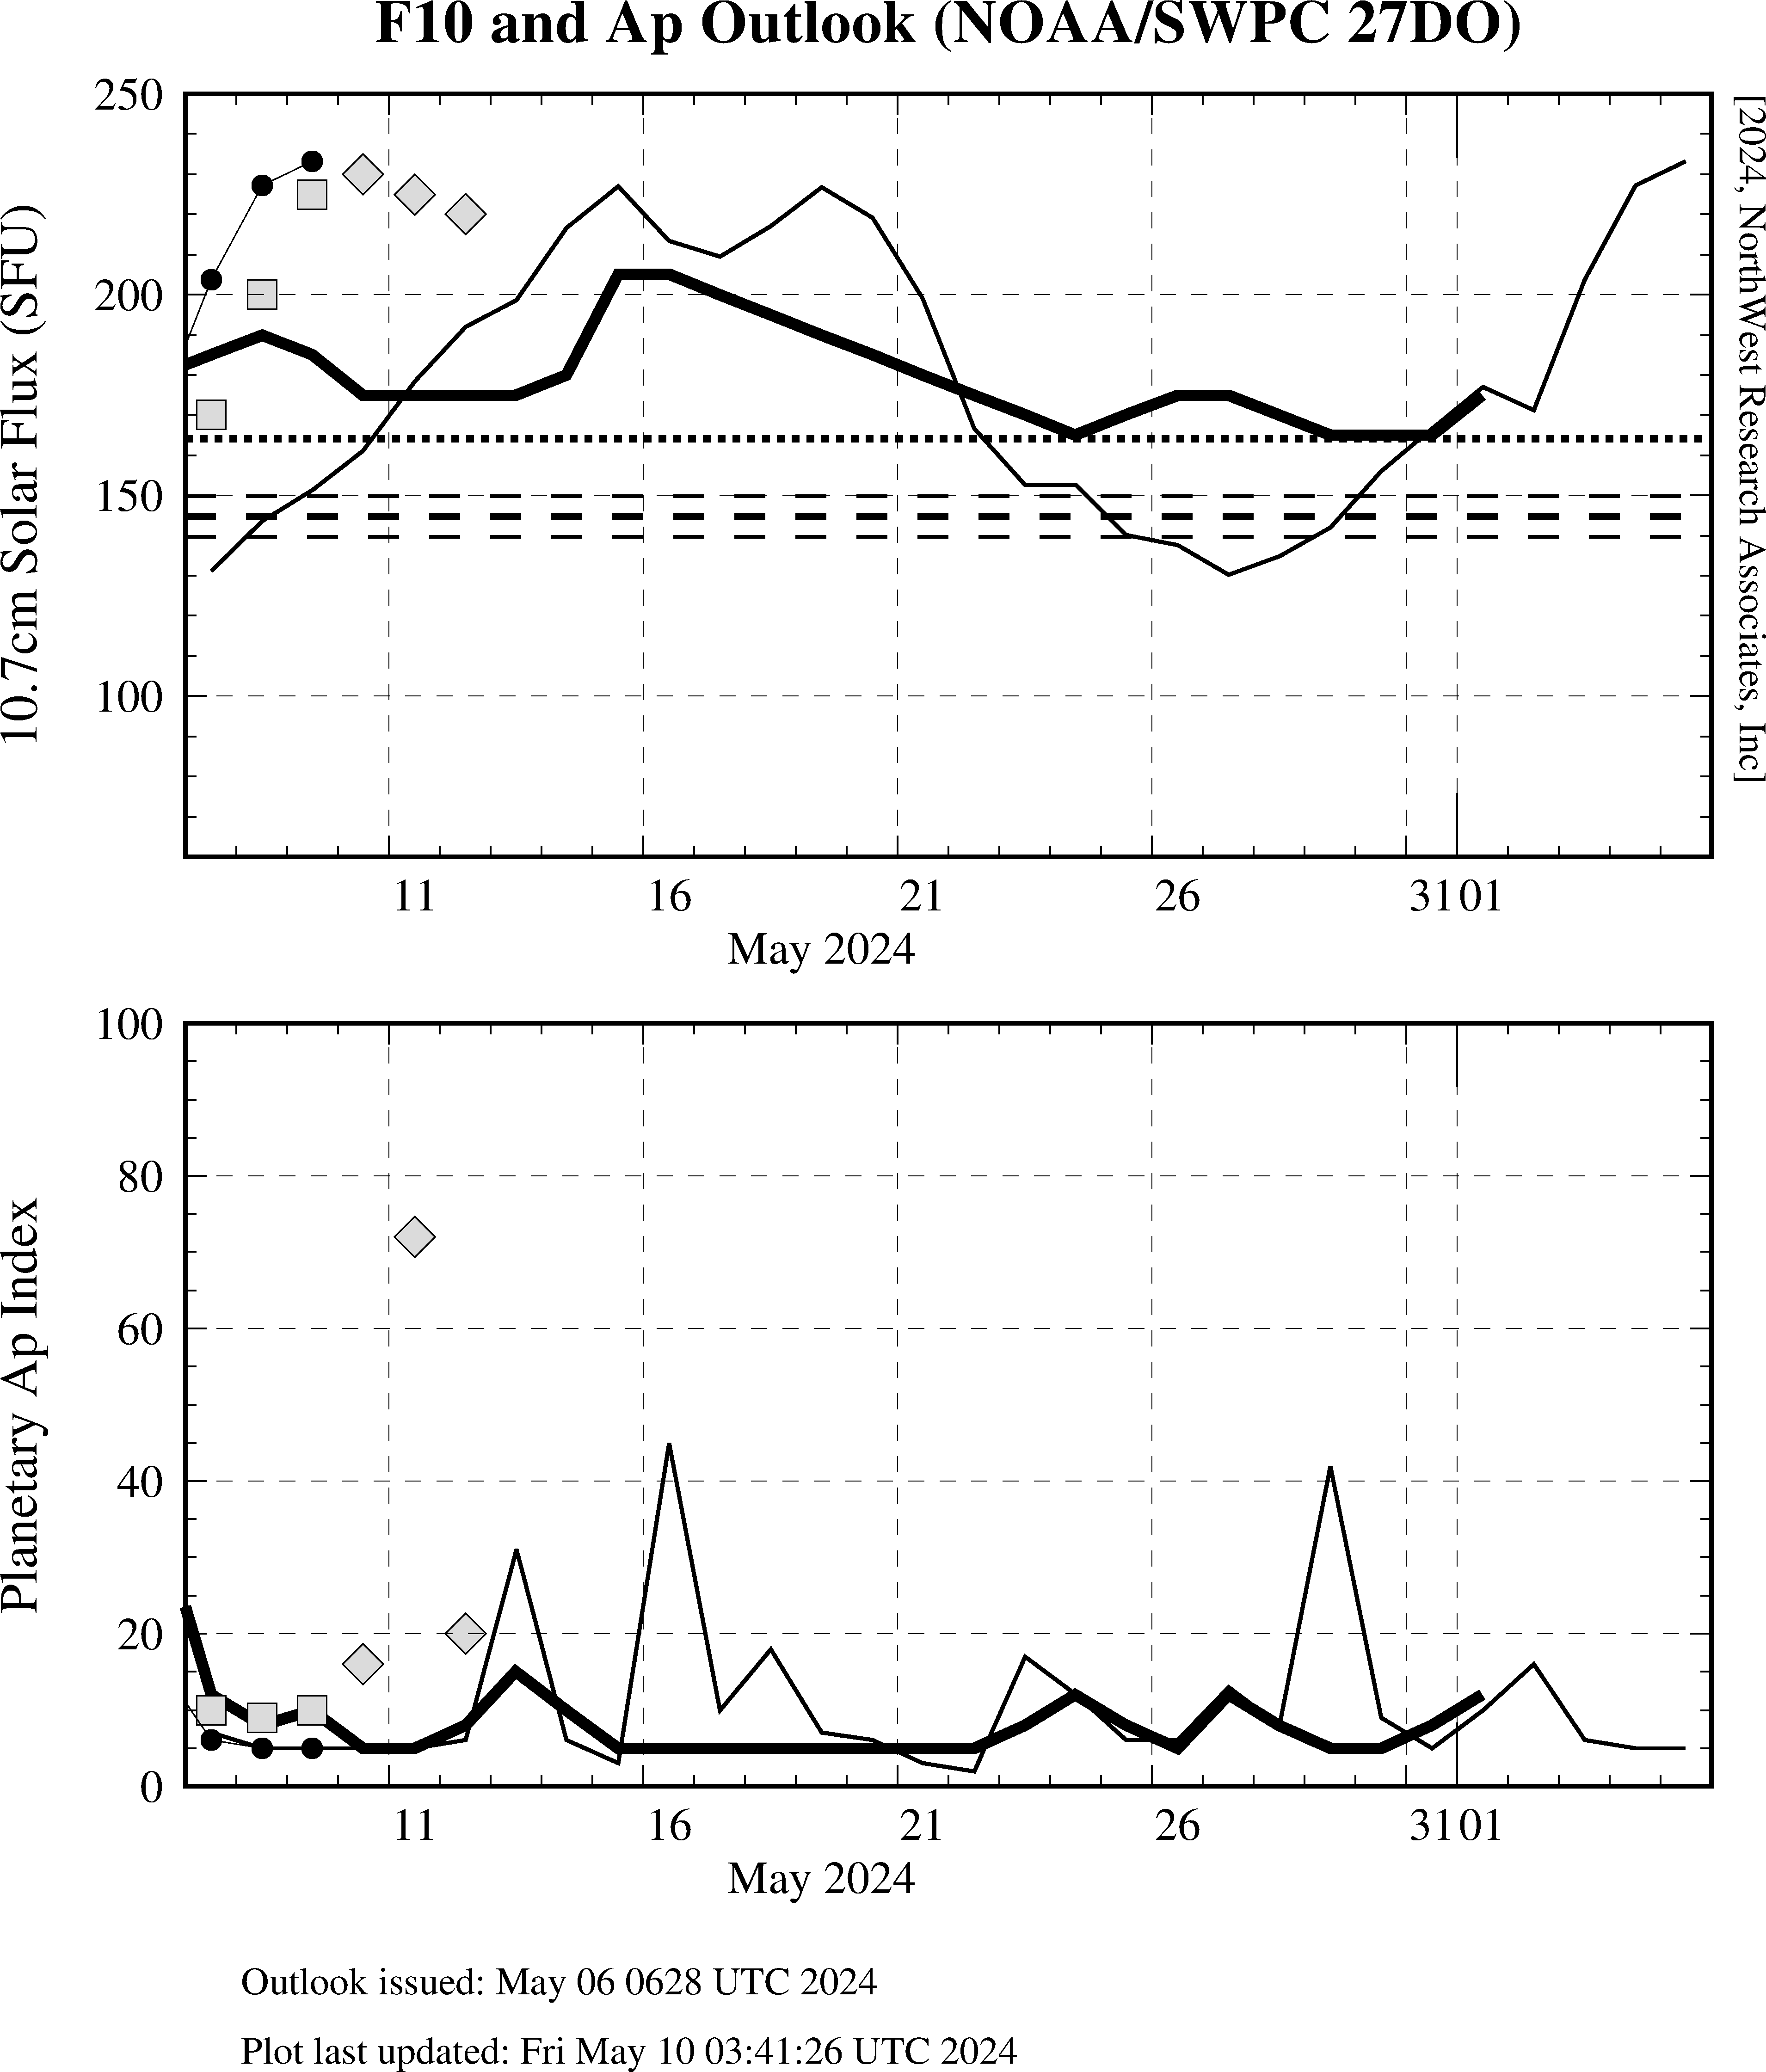
Plot updated daily prior to 23UT These plots show forecasts for the 10.7cm solar radio flux (F10) and the planetary geomagnetic activity index (Ap) for the next 27 days (heavy solid lines). The light solid lines and filled circles at the start of each plot are the observed F10 and (provisional) Ap for the past few days, and the light dashed lines show the observed F10 and Ap from the previous solar rotation. The unfilled square symbols are the SWPC previous-day predictions for F10 and Ap for the past three days, and the unfilled diamond symbols are the SWPC predictions for F10 and Ap for the upcoming three days from the latest SWPC/USAF Report of Solar-Geophysical Activity (RSGA) issued daily around 22UT. The three horizontal long-dash lines on the F10 plot indicate the mean (heavy line) and expected range (light lines below and above the heavy line) of F10 from the NOAA SWPC long-range prediction for Solar Cycle 24 (modified by JAS). The single horizontal dotted line is the 90-day mean F10 flux for the preceeding 90-day period. The forecasts are a product of the NOAA Space Weather Prediction Center(SWPC). All questions regarding the veracity and validity of these predictions and the methodologies used in producing them should be directed to the NOAA/SWPC. NOTE: This forecast is routinely updated by SWPC on a weekly basis (every Monday at around 04UT currently). |

Copyright © 1996-2024 NorthWest Research Associates, Inc. All rights reserved.