
|
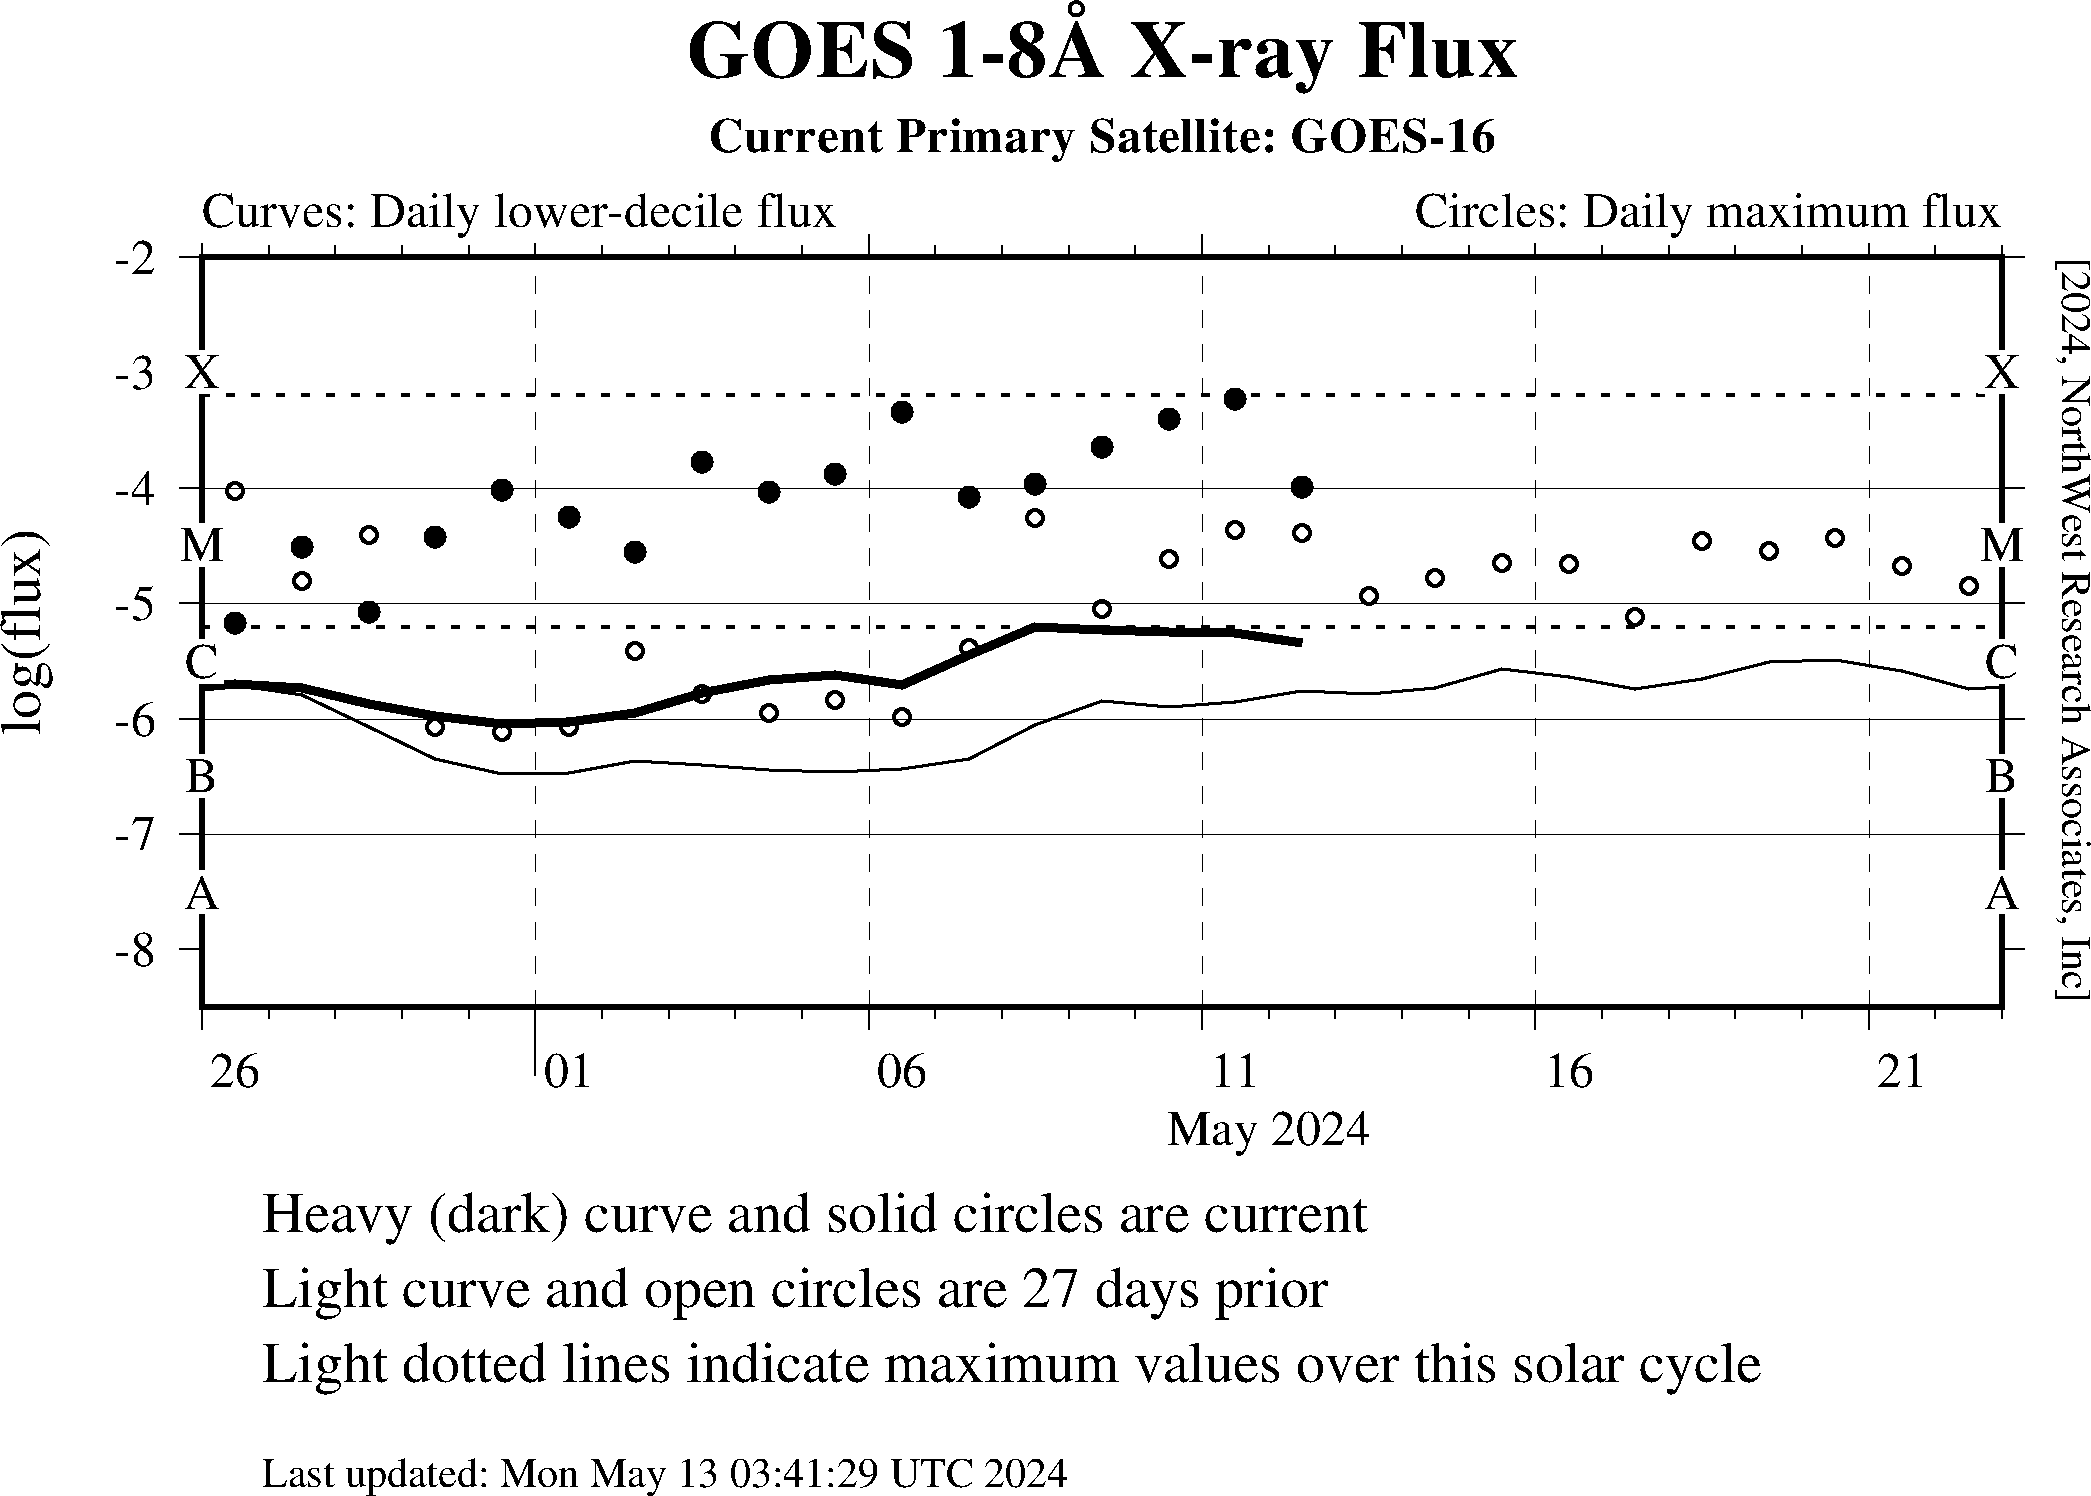
The data in this plot are from the 1-8 Angstrom (10-80 nm) x-ray sensor on one of the NOAA GOES satellites. Provided are the daily lower-decile x-ray flux (curves) and the daily peak flux (dots and circles) for the last 17 days (heavy curve and dots) and for the previous solar rotation (light curve and circles). The ranges of the standard x-ray flare classifications (A,B,C,M,X) are indicated along the left and right boundaries of the plot area. The Current Primary Satellite is the GOES satellite identified by the SWPC as the primary for x-ray observations at the time the plot was updated. These data were downloaded from the NOAA Space Weather Prediction Center servers (file xrays-1-day.json). |

Copyright © 1996-2024 NorthWest Research Associates, Inc. All rights reserved.