

|
Note: This plot is updated hourly.
Track the status of the solar-cycle for the past 24 months or for Cycles 23-25.
If you are looking for the observed sunspot number derived from optical
observations of the sun, you've been miss-routed.
These plots provide a look at the global behavior of the ionospheric F2 layer over the past week as measured by the NWRA effective sunspot number (SSNe) calculated from current observations. The upper panel shows the SSNe variation, the third panel provides a goodness-of-fit metric (described below), and the lower panel gives the total number of foF2 observations in each SSNe calculation. Data used in this estimate are from observations between -50 and +50 degrees geomagnetic latitude only. In all three panels the heavy curve uses data collected from the previous 24 hours; light curve the previous 6 hours. (Note that the quasi- diurnal variation in the 6 hour SSNe values is primarily due to unequal longitude spacing of the foF2 stations from which the SSNe are being calculated.) The second panel shows the provisional (quicklook) Kp index from GFZ Potsdam. This is provided to assess the impact of geomagnetic activity on SSNe. Also shown on the upper panel is the long-term predicted smoothed sunspot number as provided by the NOAA Space Weather Prediction Center. The heavy dash line is the expected value from the prediction, and the two light dashed lines are the upper- and lower-bounds on the expected value. The heavy dotted line indicates the highest value for both-hemisphere 24-hour SSNe so far in Cycle 25. Note that these values have been converted from the new (V2) sunspot number scaling to the old (V1) scaling, which is the scaling used by the SSNe estimates. The goodness-of-fit metric shown in the middle panel is the RMS percent difference between the foF2 observations used in the SSNe calculations and the model foF2 values generated using the SSNe in the URSI-88 foF2 model. It generally runs around 15%, with the largest departures occurring during major geomagnetic disturbances The following table summarizes the observations used in calculating the most recent SSNe value. The X entry for a particular station/time indicates there was an foF2 value available and it was used in the SSNe calculation. A - entry indicates that an foF2 value was available, but it was excluded from the SSNe calculation (it was identified as an outlier point). The bar (|) symbol along the time axis of the table indicates the latest-data time (i.e., data to the right of this column are from the previous day).Date: 20240512 000000000011111111112222 GMLAT Station Used Rej 012345678901234567890123 ----- ------------------- ---- ---- +------------------|-----+ 49.3 EAREKSON 16 00 | XXXXXXXXXXXXXXXX | NH 48.7 CHILTON 10 00 |X X X X XXXXXX | NH 46.4 PRUHONICE 22 01 |XXXXXXX XXXXXXXXXXXX-XXX| NH 41.5 EGLIN_AFB 18 00 |XXXXXXXXXXXXXXXXX | X| NH 40.6 AUSTIN 20 01 |XXXXXXXXXXXXXX-XXXXXX | NH 36.8 ROME 23 00 |XXXXXX XXXXXXXXXXXXXXXXX| NH 35.6 SAN_VITO 24 00 |XXXXXXXXXXXXXXXXXXXXXXXX| NH 32.2 GIBILMANNA 16 00 | XXXXXXXXXXXXXXXX | NH 31.6 I-CHEON 15 00 | X XX XXXXXXXXXXXX| NH 27.8 JEJU 13 00 | XXX XXXXXXXXXX| NH 21.6 LUALUALEI 20 00 |XXXXXXXX XXXXXXXXXX X X| NH -16.3 TUCUMAN 24 00 |XXXXXXXXXXXXXXXXXXXXXXXX| SH -19.0 ASCENSION 22 00 |XXXX XXXXXXXXXXXXXXXXXX| SH -20.0 CACHOEIRA_PAULISTA 22 00 |XXX XXXXXXXXXXXXXXXXXXX| SH -27.9 BAHIA_BLANCA 13 00 |XX XXXXXXXXXX X| SH ------------------- ----- ---- ---- +------------------|-----+ NH : # Expected / # Received / Percent / Min Dt: 672 / 199 / 29.6 / 0 ALL : # Expected / # Received / Percent / Min Dt: 1152 / 280 / 24.3 / 0 SH : # Expected / # Received / Percent / Min Dt: 312 / 81 / 26.0 / 0 List of stations providing foF2 observations ordered by time since the last observation. This list covers only the past 31 days. If you would like to get a feel for how effective these effective-SSN indices are, foF2 plots comparing the observations with model foF2 values calculated using the NWRA SSNe and the SWS T indexes are available. There is a one-day delay between the latest SSNe values available and these plots to permit more data to arrive at the NOAA NCEI for comparison.
|

Copyright © 1996-2024 NorthWest Research Associates, Inc. All rights reserved.
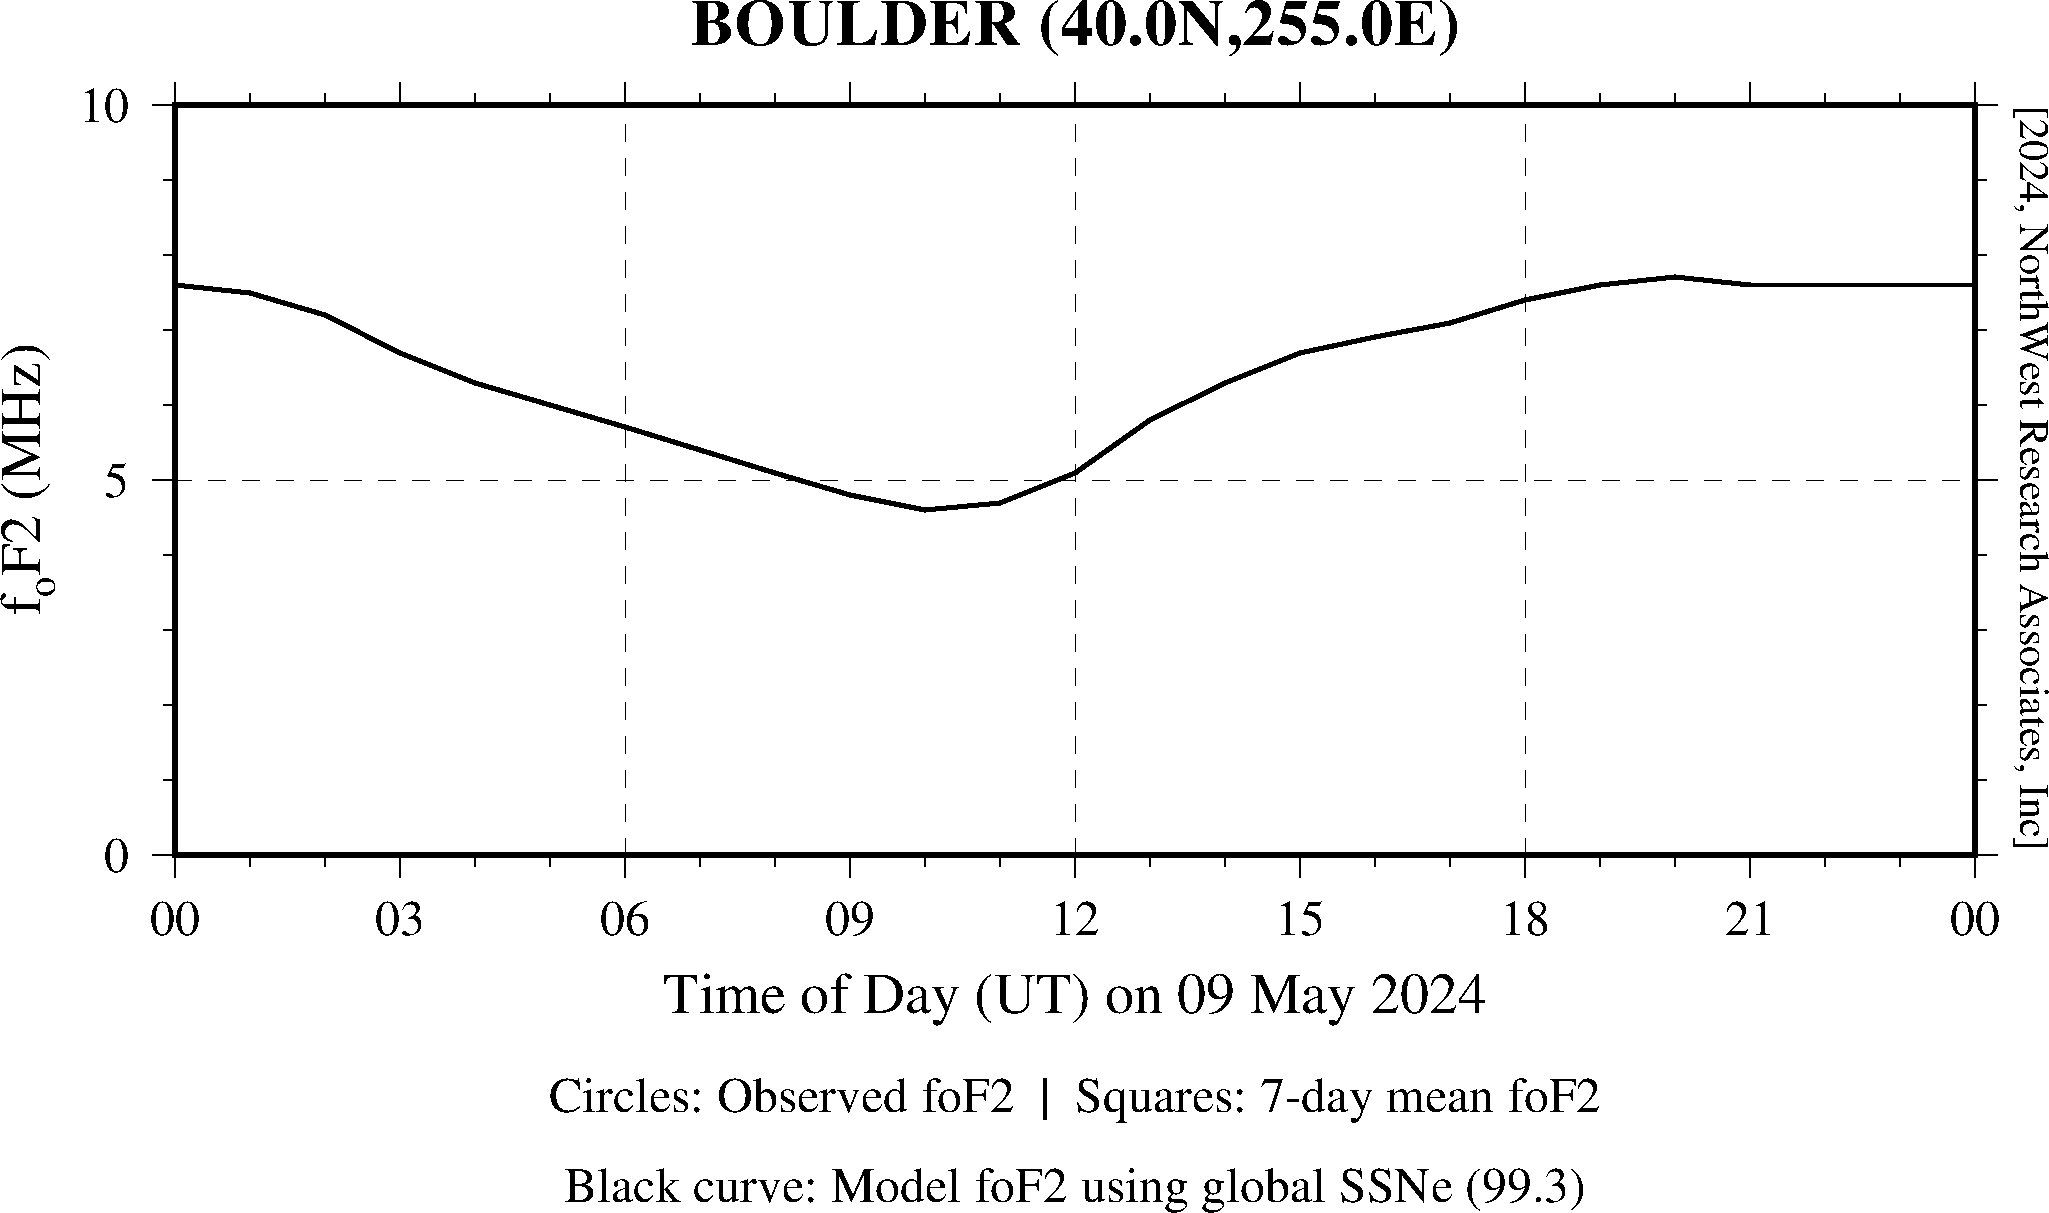 Daily foF2 Comparison Plots