
|
Note: This plot is updated daily. Follow me for hourly SSNe updates.
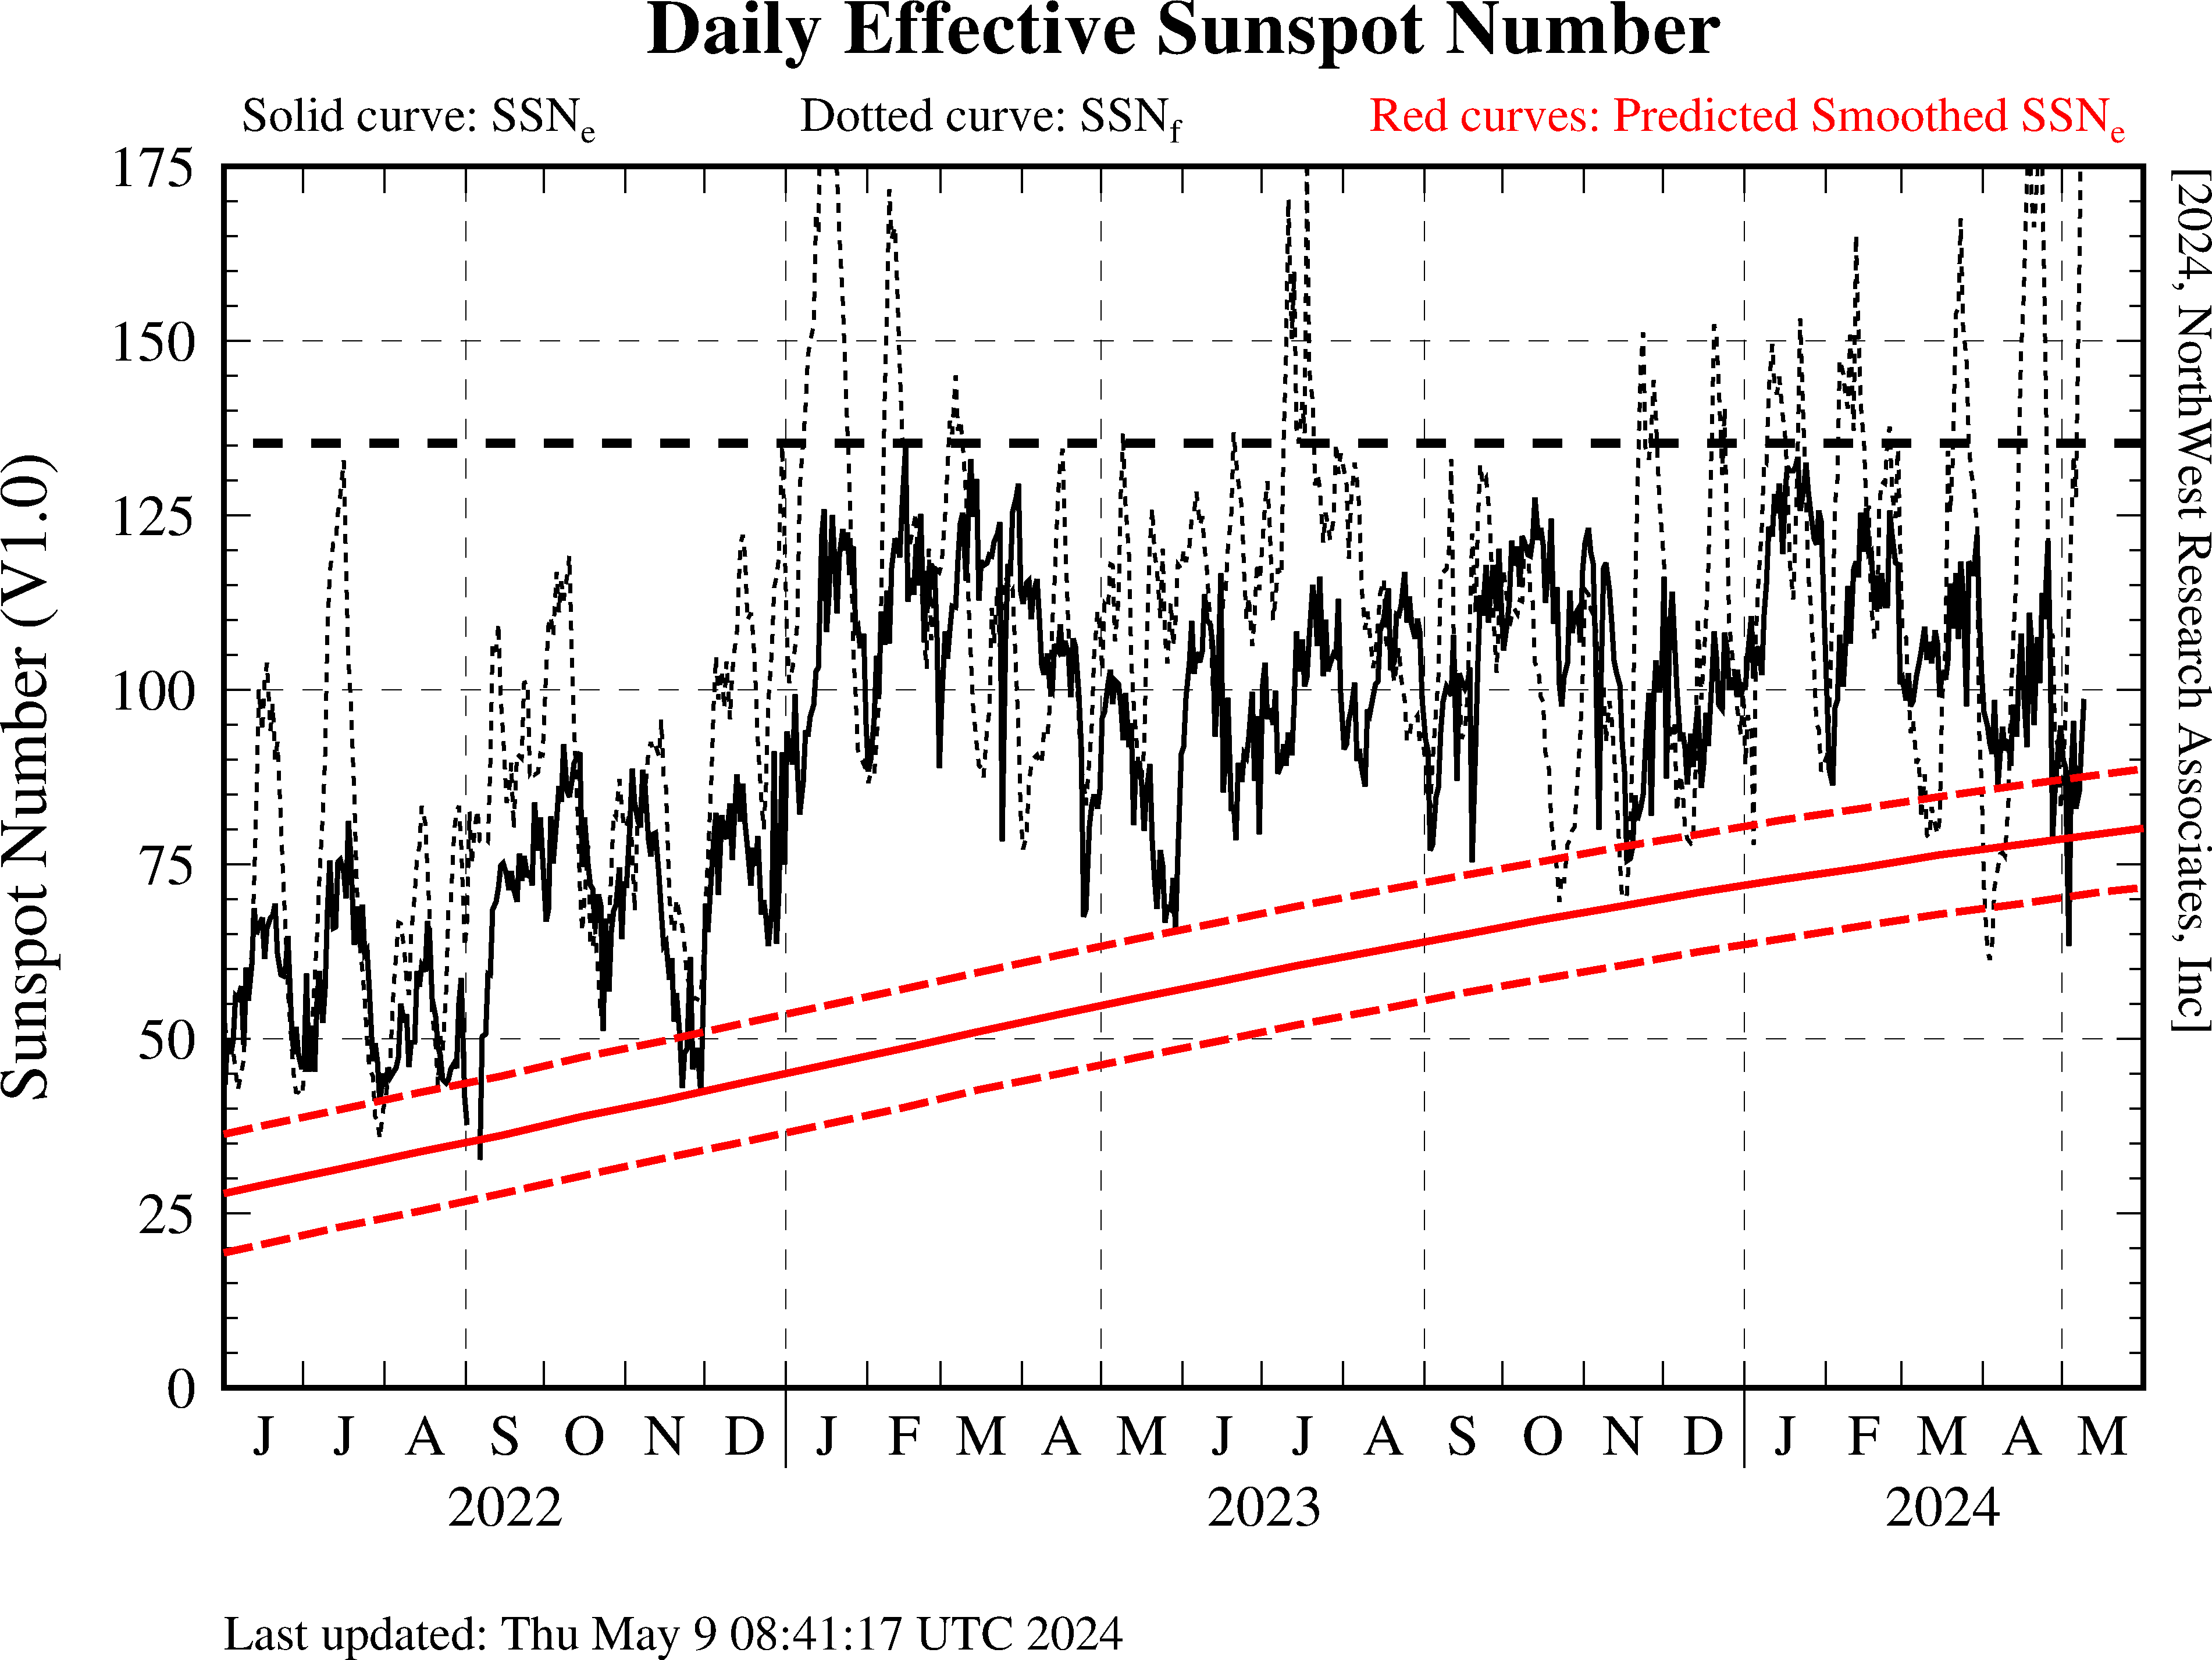
This plot provides a look at the progression of the solar cycle over the past 24 months. Two parameters are plotted: the daily effective SSN (solid line) based on analysis of ionospheric foF2 data, and the daily F10.7 SSN based on the observed Penticton 10.7cm solar radio flux. The foF2 data used in the SSNe calculations were obtained from the National Centers for Environmental Information (NCEI). The heavy dashed line in the plot indicates the maximum 24-hour SSNe that has been observed to date during Cycle 25. The solid and dashed red curves are a prediction of the 13-month smoothed SSNe as described in the SSNe solar-cycle plots. Please note that the SSNe values plotted here were calculated in near real-time from a limited data set. If you are interested in post-analysis SSNe values calculated from a more representative data set, please contact NWRA. |

Copyright © 1996-2024 NorthWest Research Associates, Inc. All rights reserved.