
This page provides access to plots of several indices of solar and geomagnetic activity that are frequently used as inputs to space-weather models. Brief definitions of each of the indices plotted are as follows:
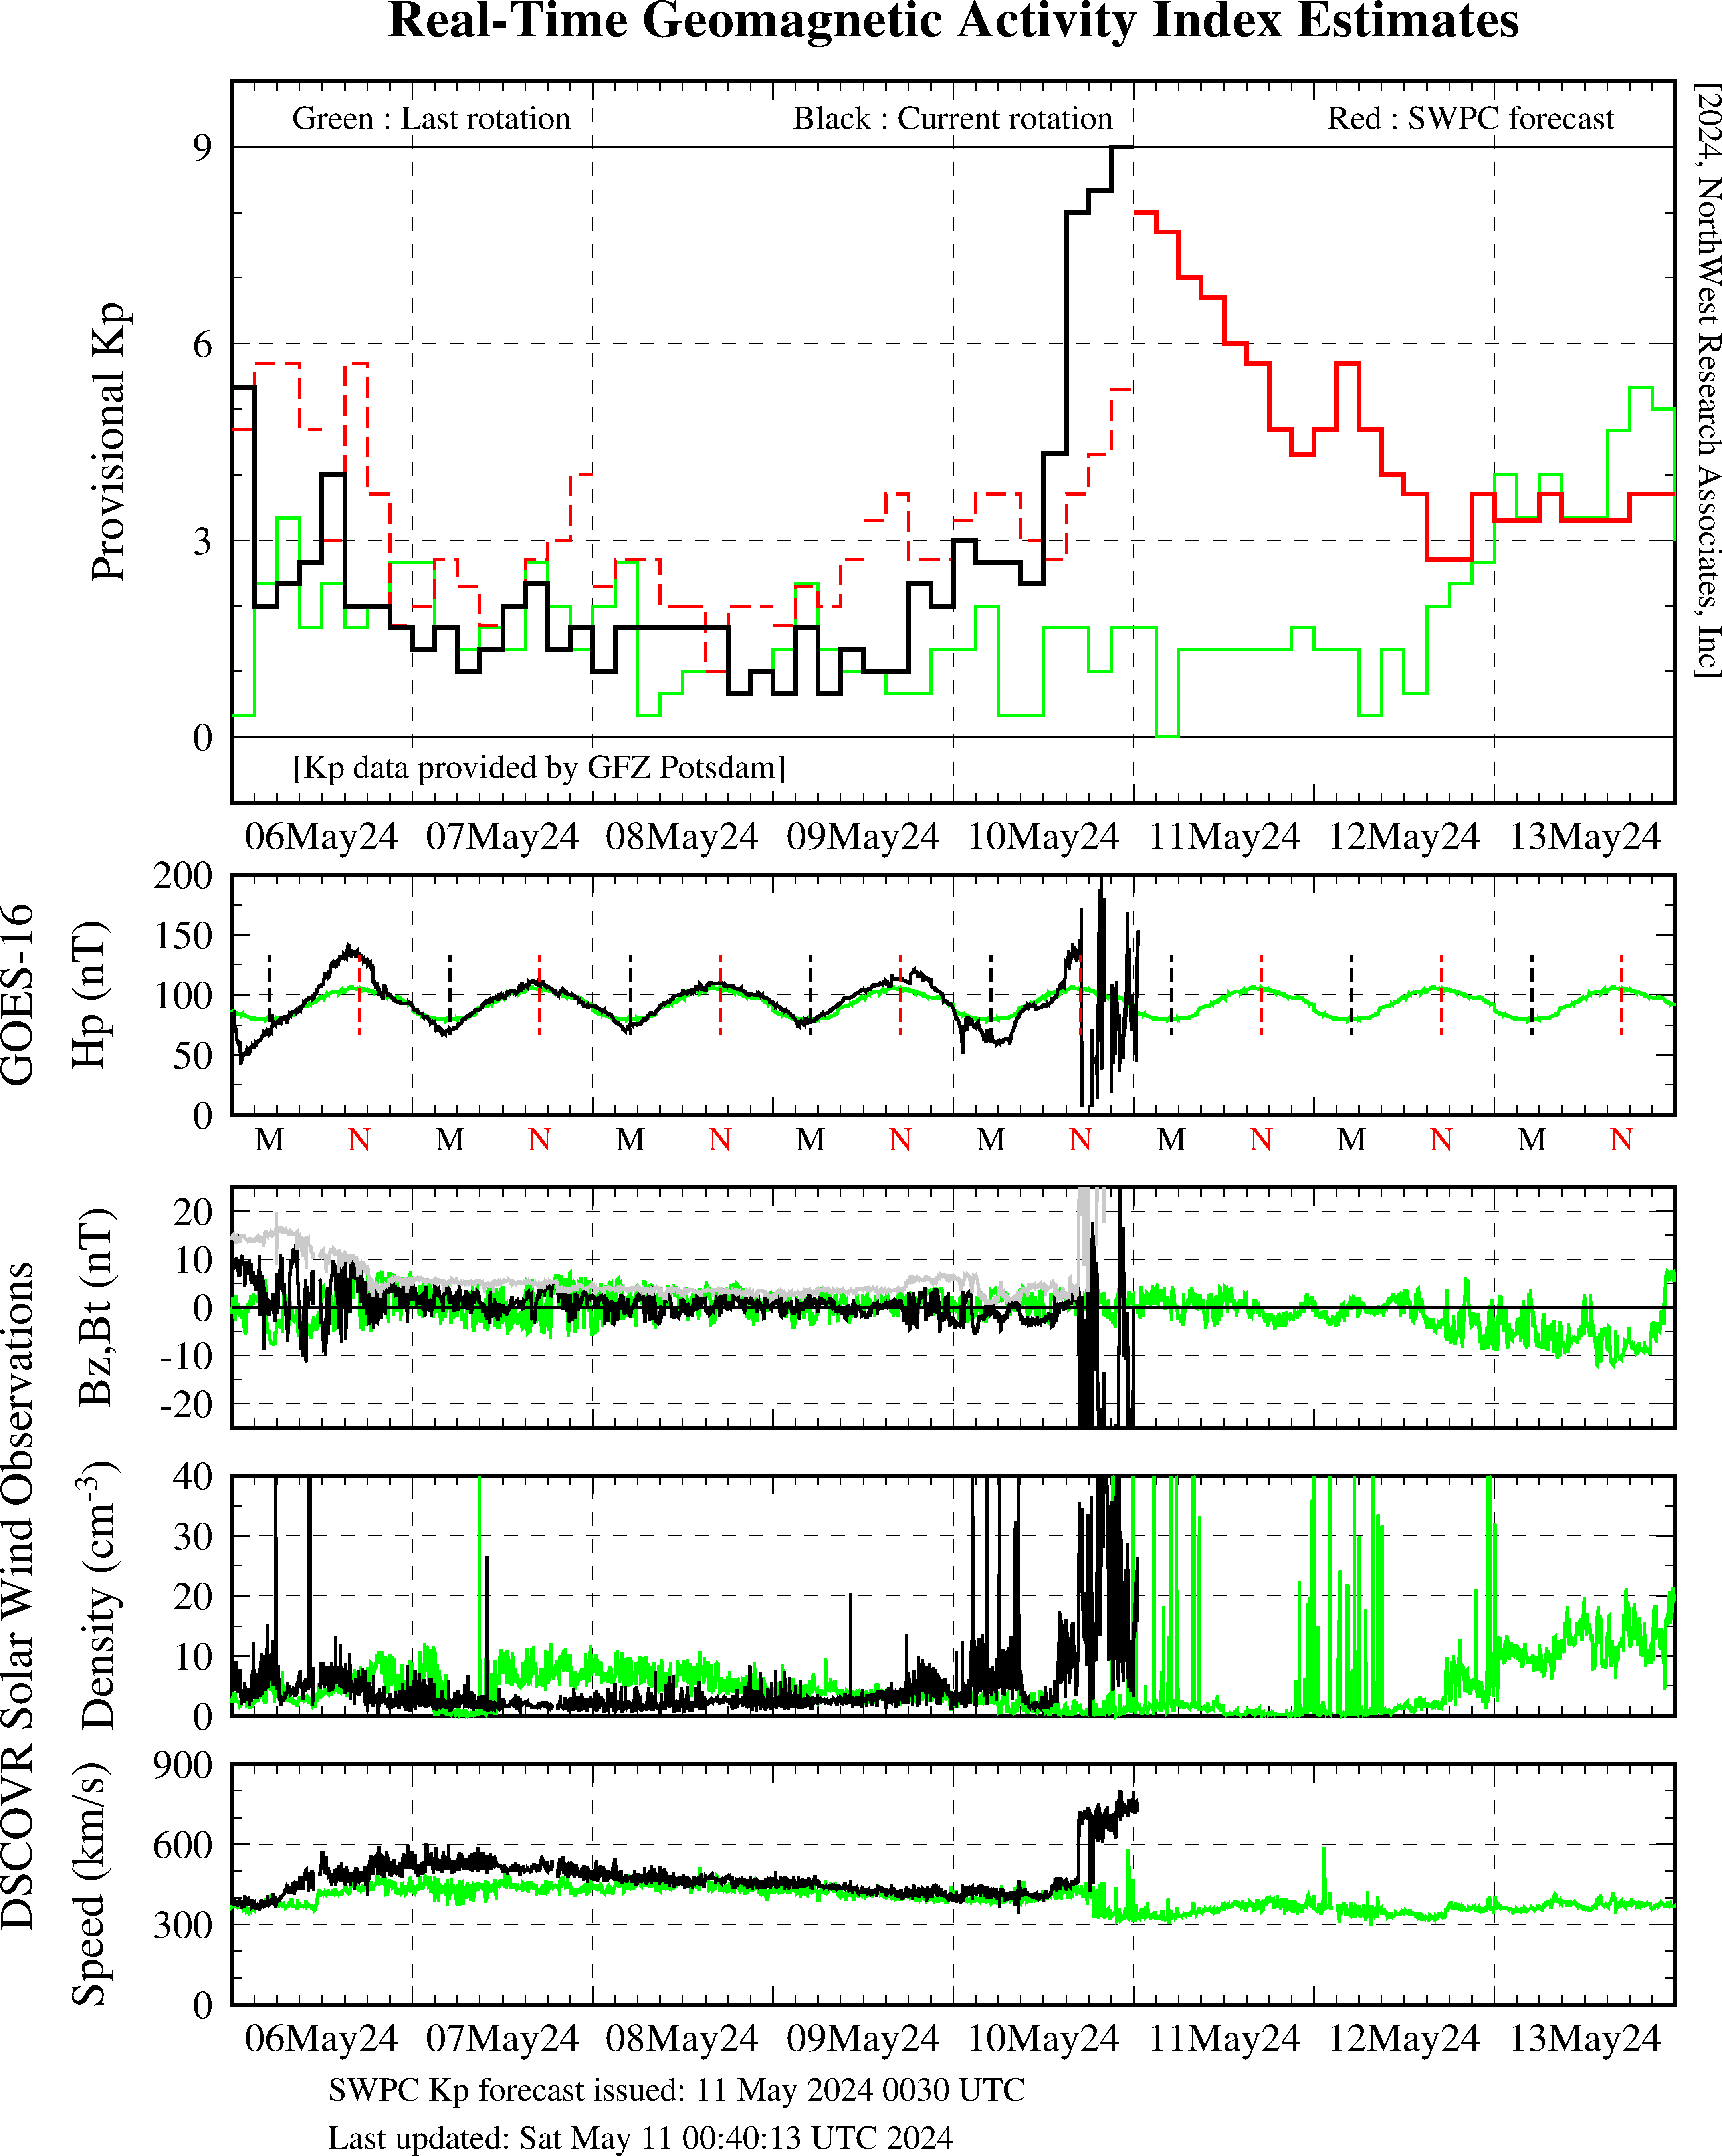 Plot of (Provisional) Kp Geomagnetic Activity Index, DSCOVR solar wind data, GOES Magnetometer data
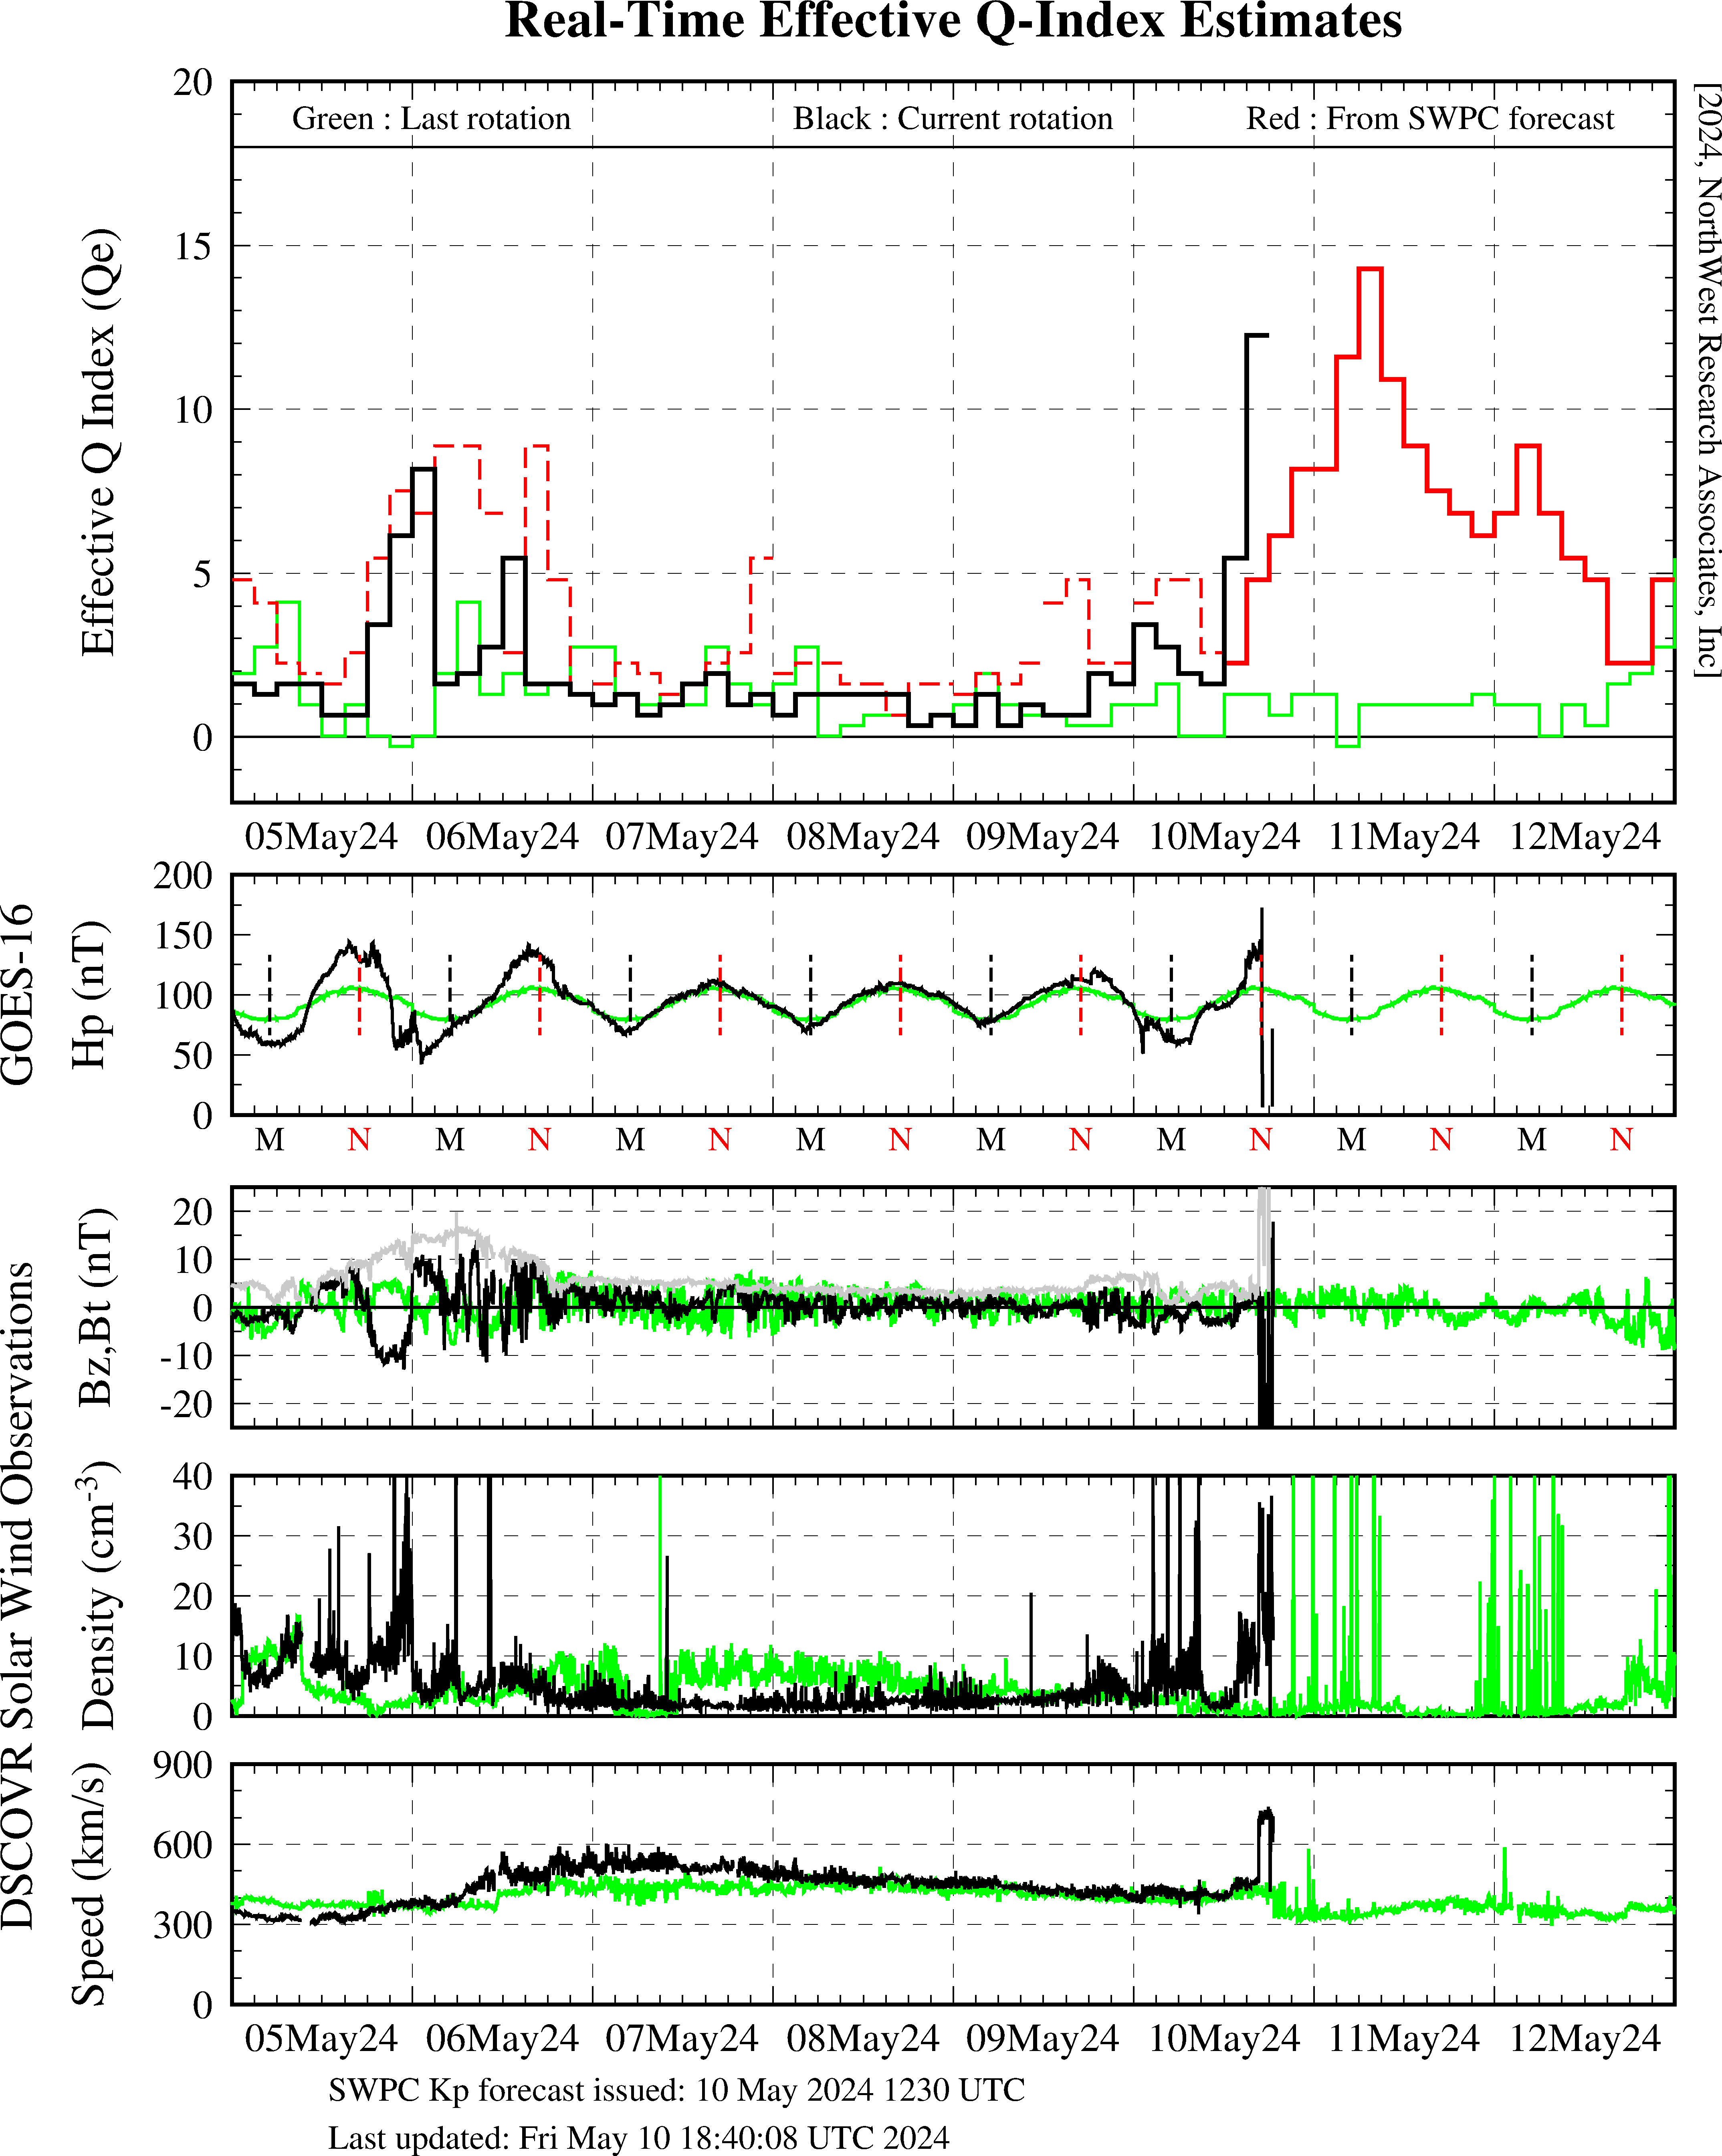 Plot of Qe Auroral Oval Index, DSCOVR solar wind data, GOES Magnetometer data
 Plot of R/T 24hr SSNe Index
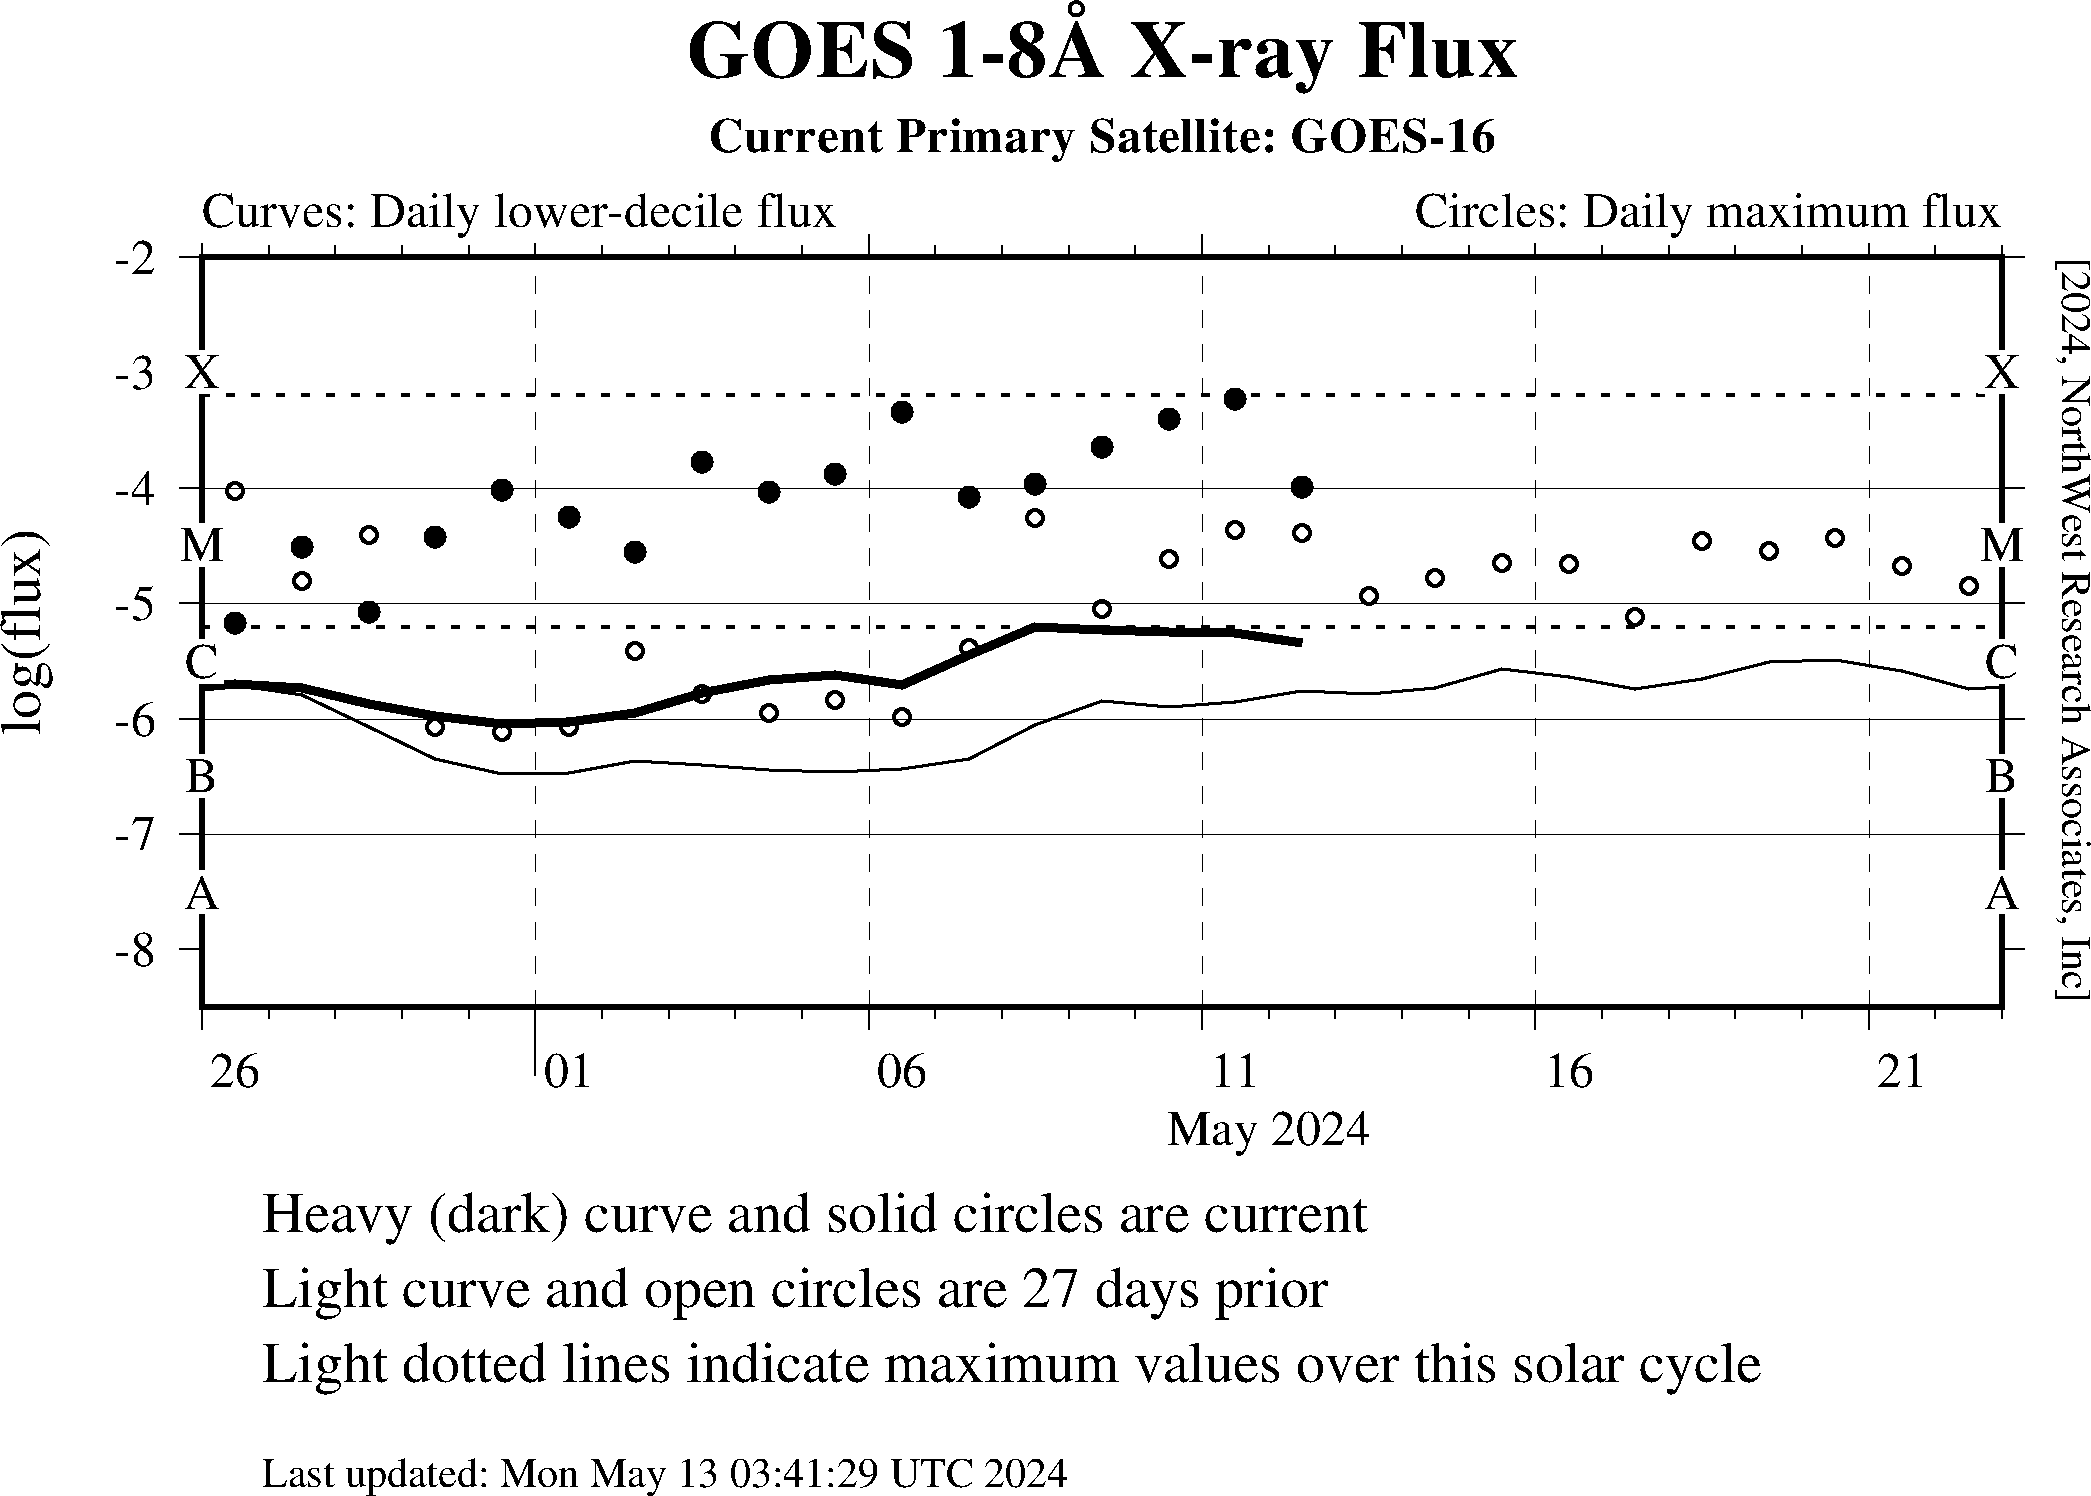 1-8 Angstron Solar X-ray Flux
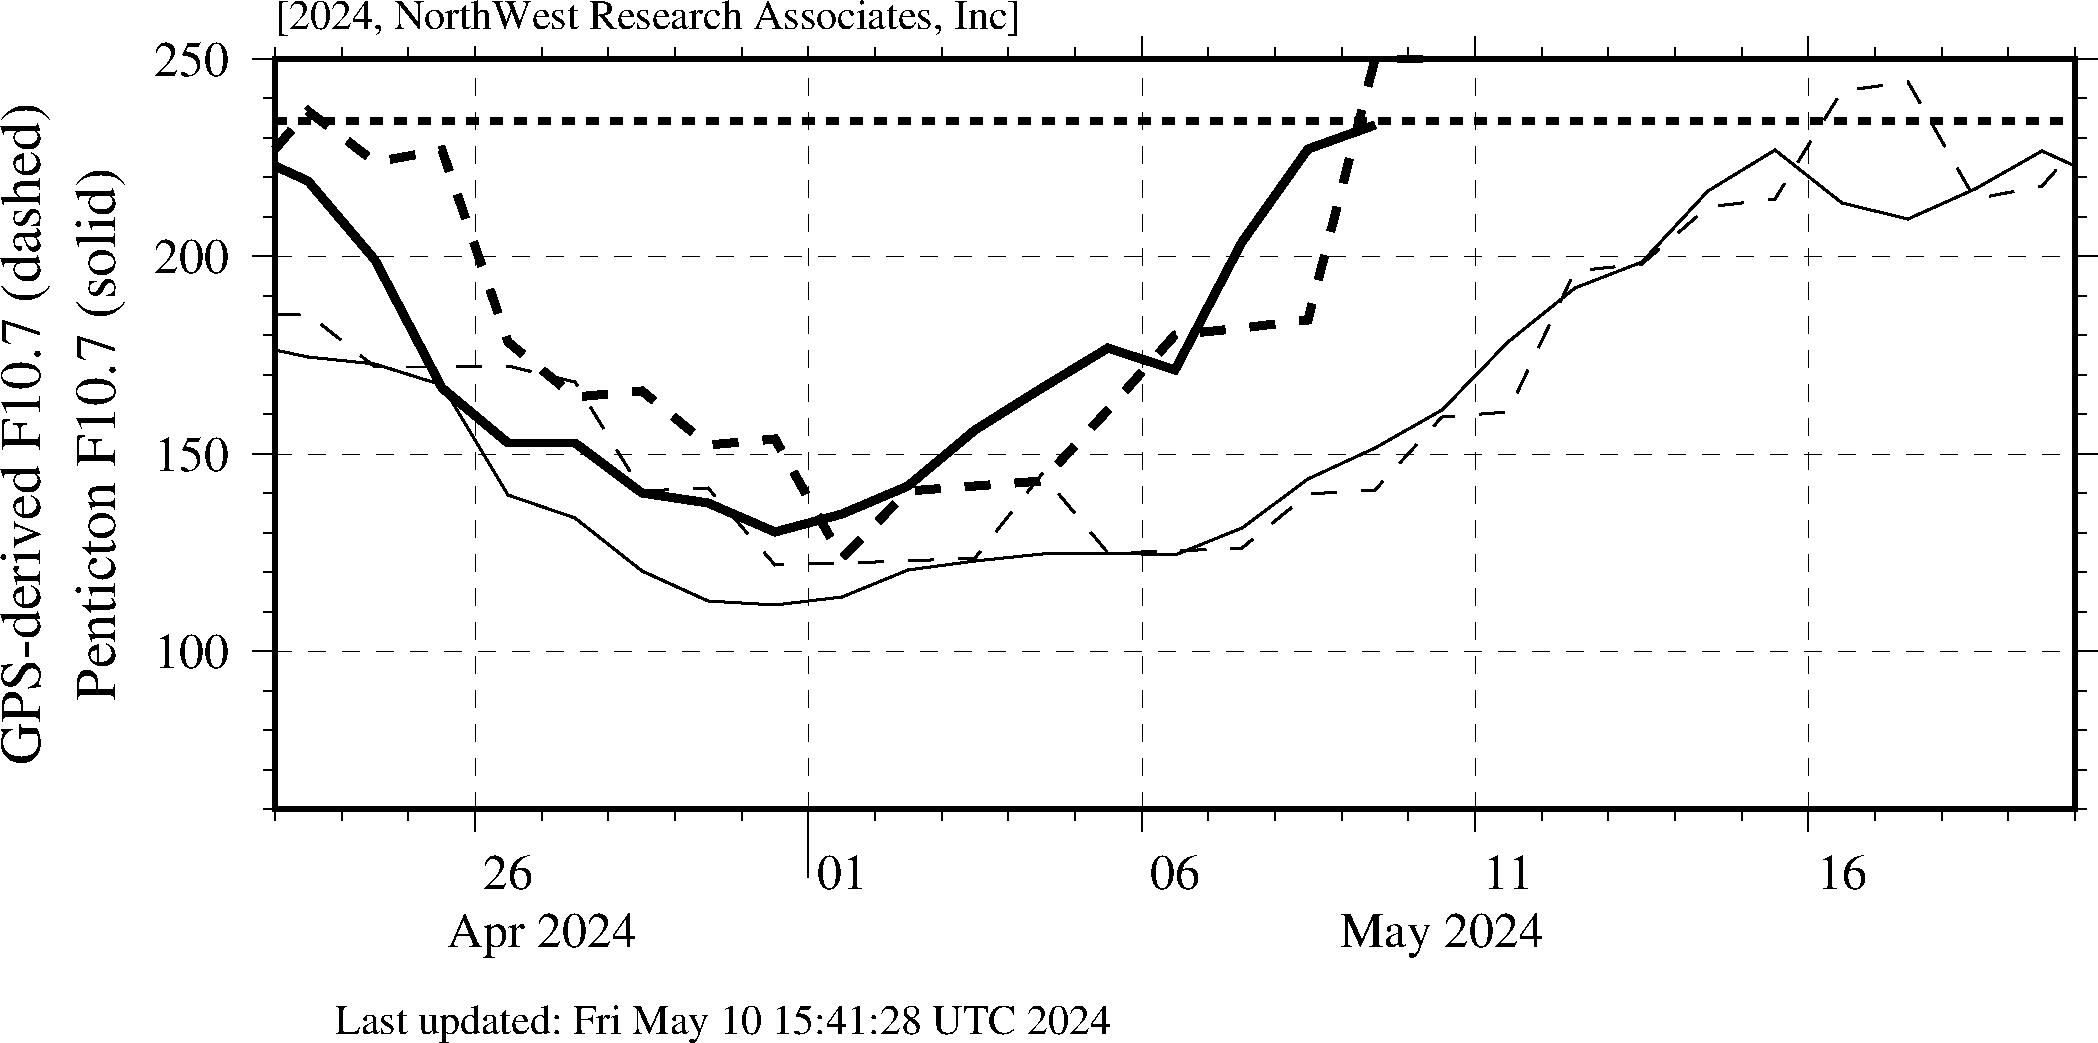 10.7cm Solar Radio Flux (Observed and Inferred)
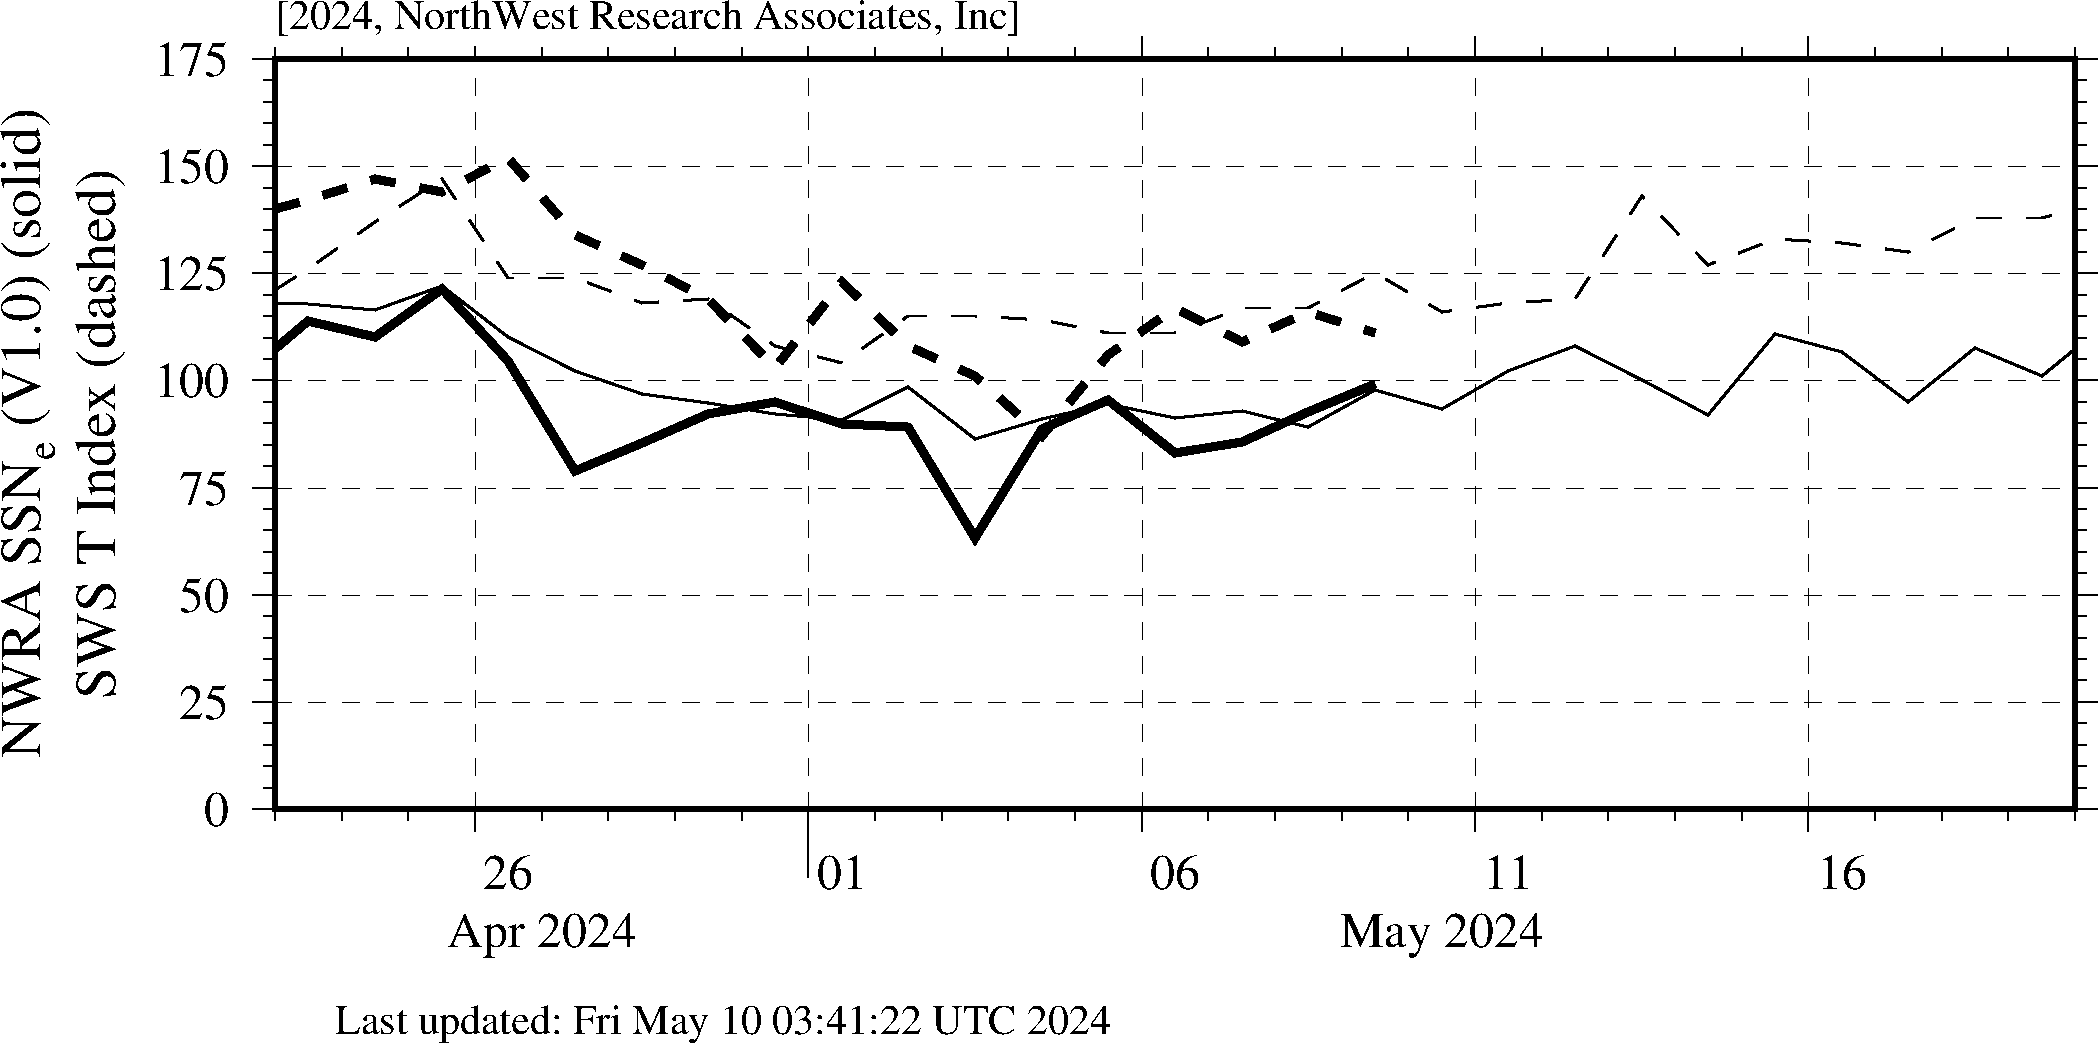 Effective SSN and T Indices
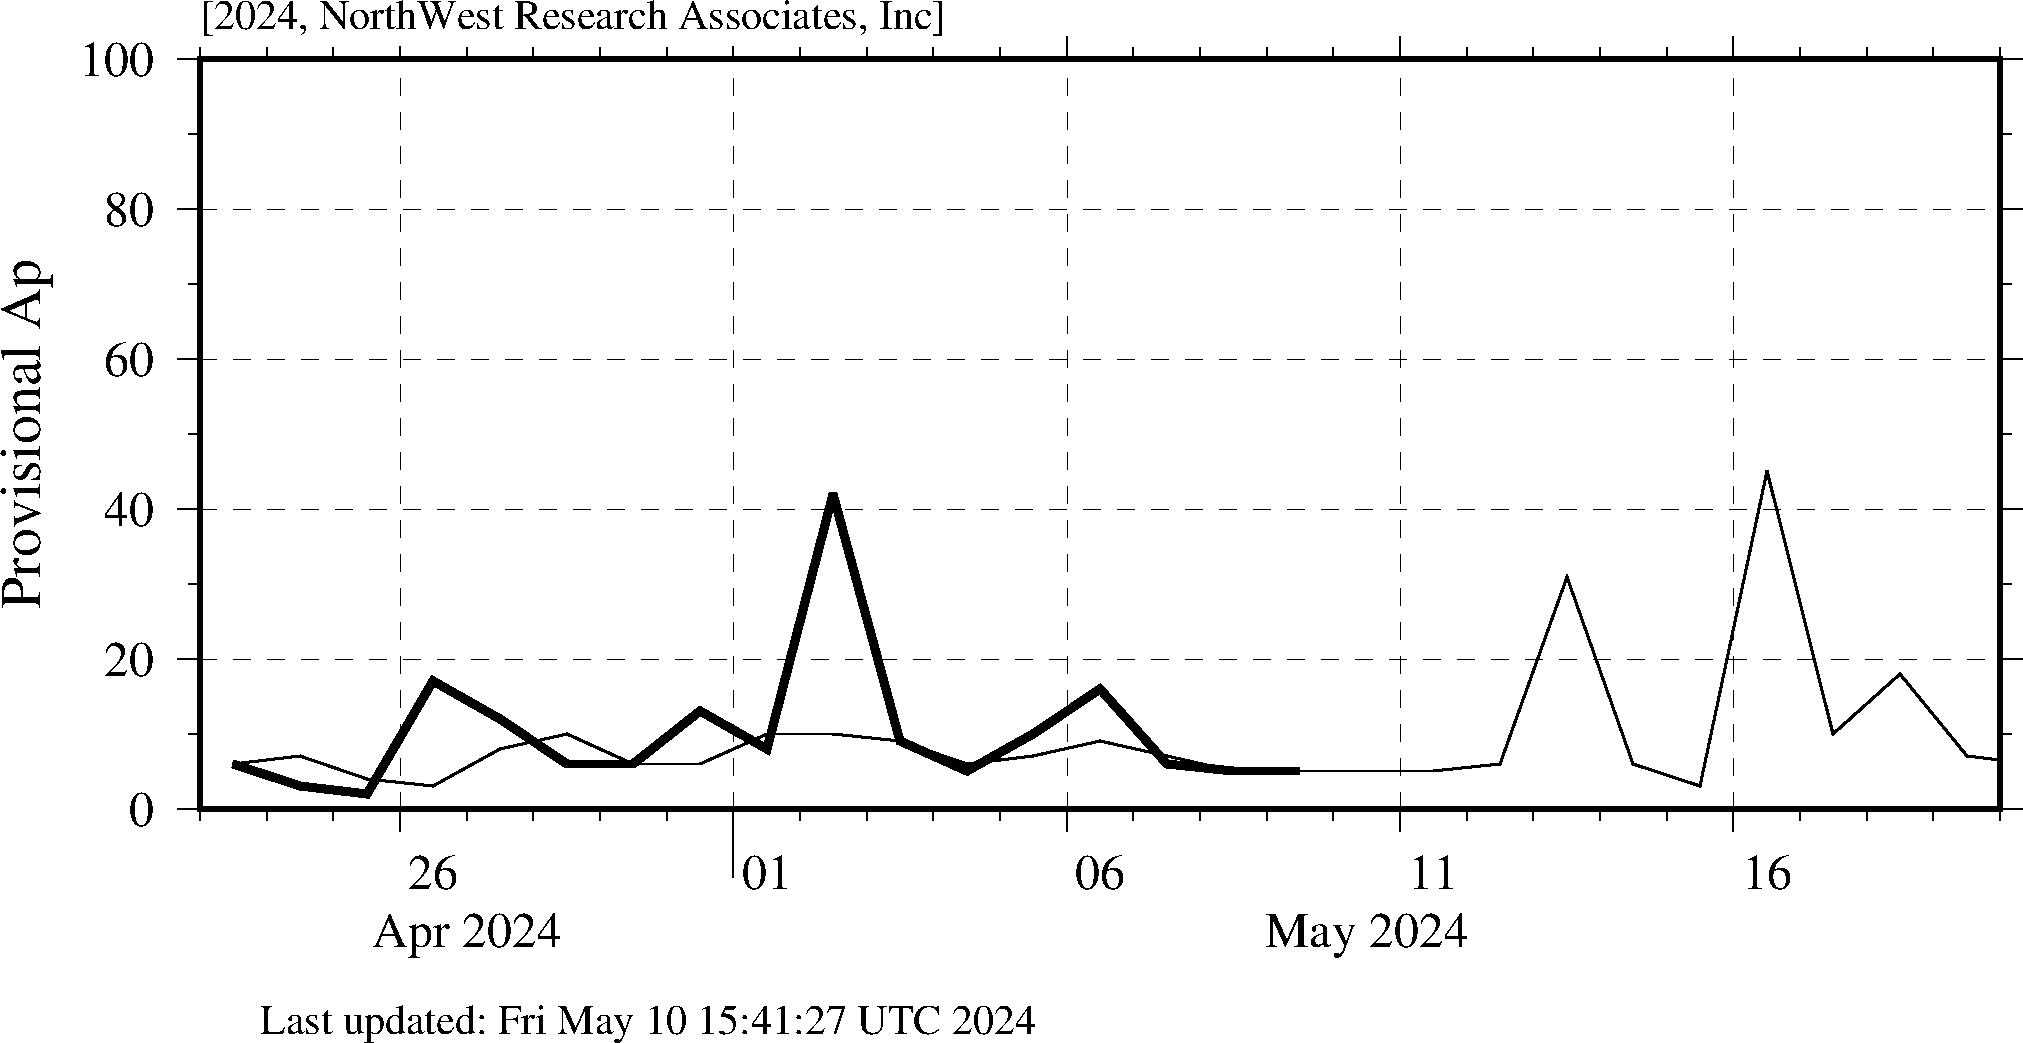 Geomagnetic Daily Ap Index (Provisional)
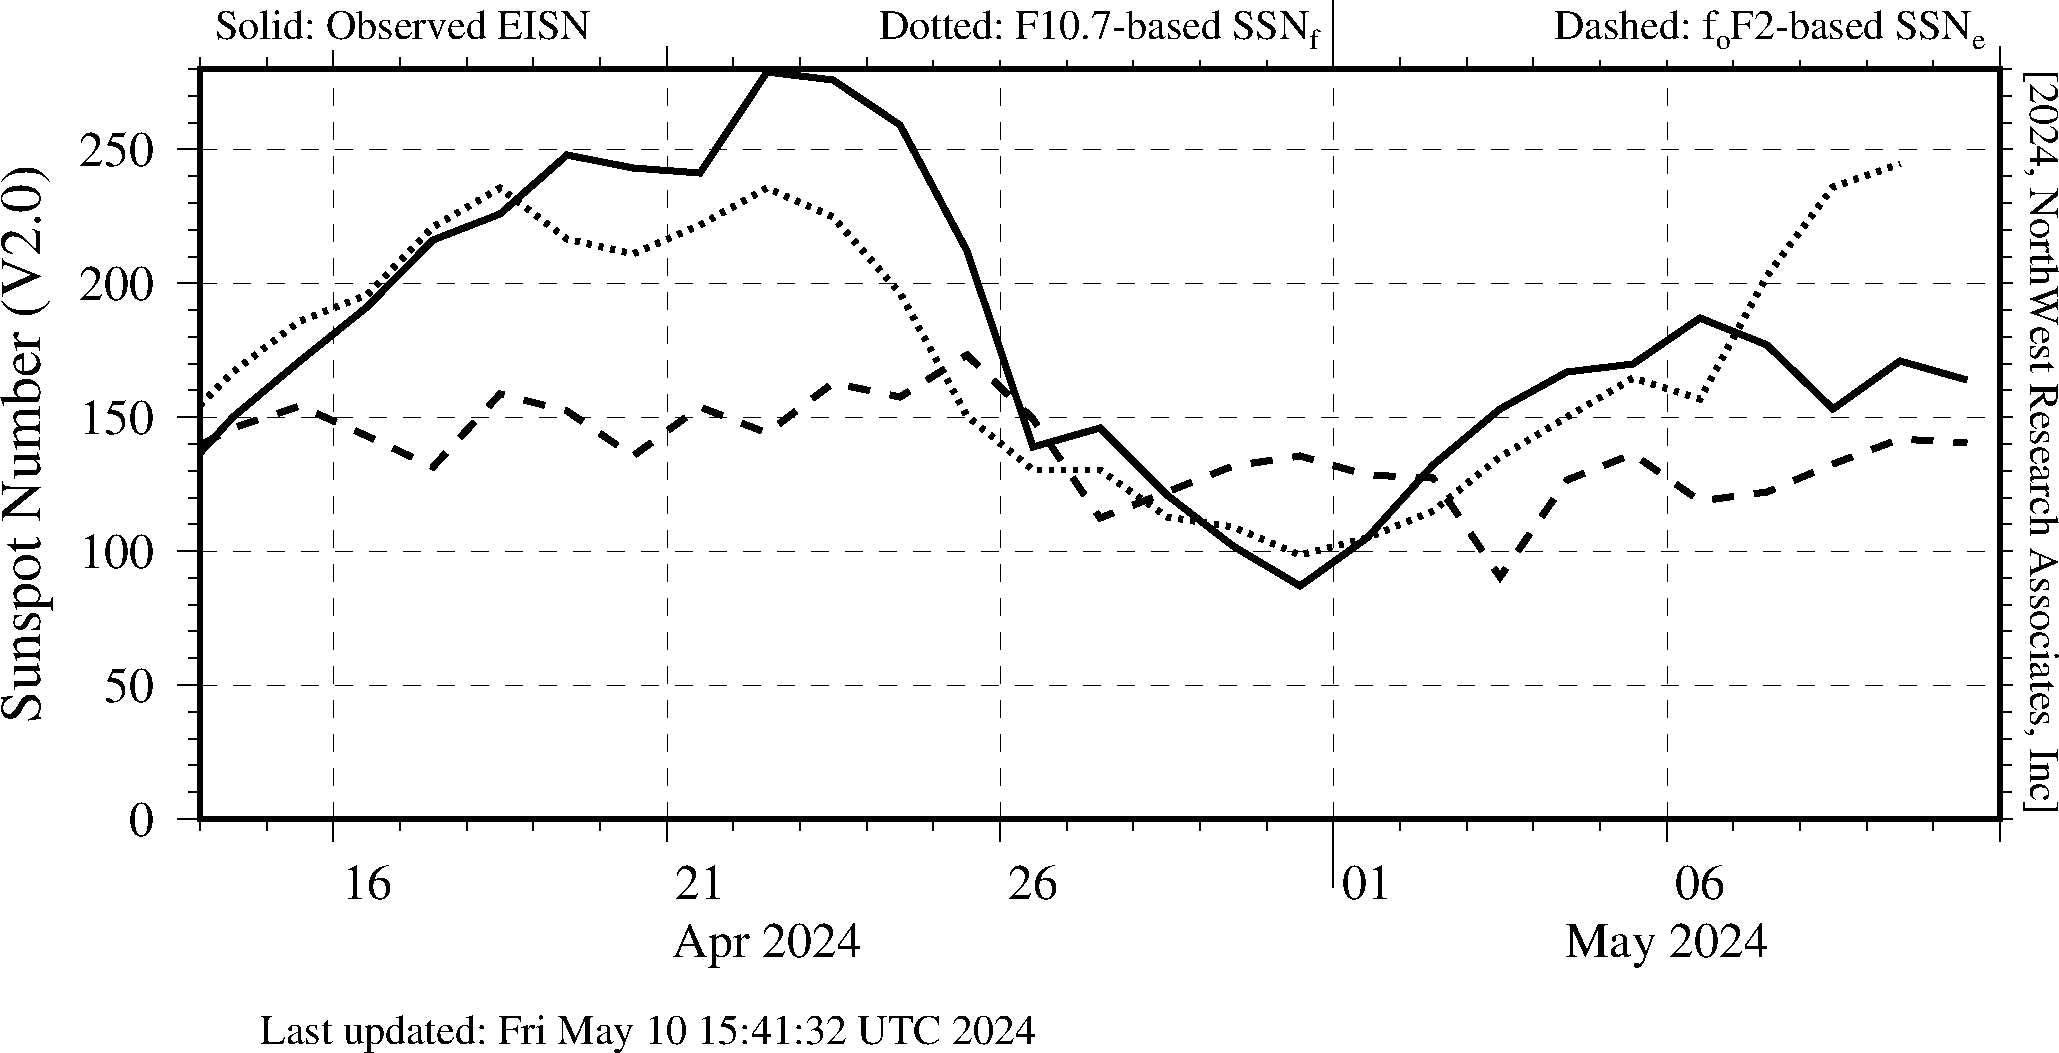 Comparison of SSN Indices
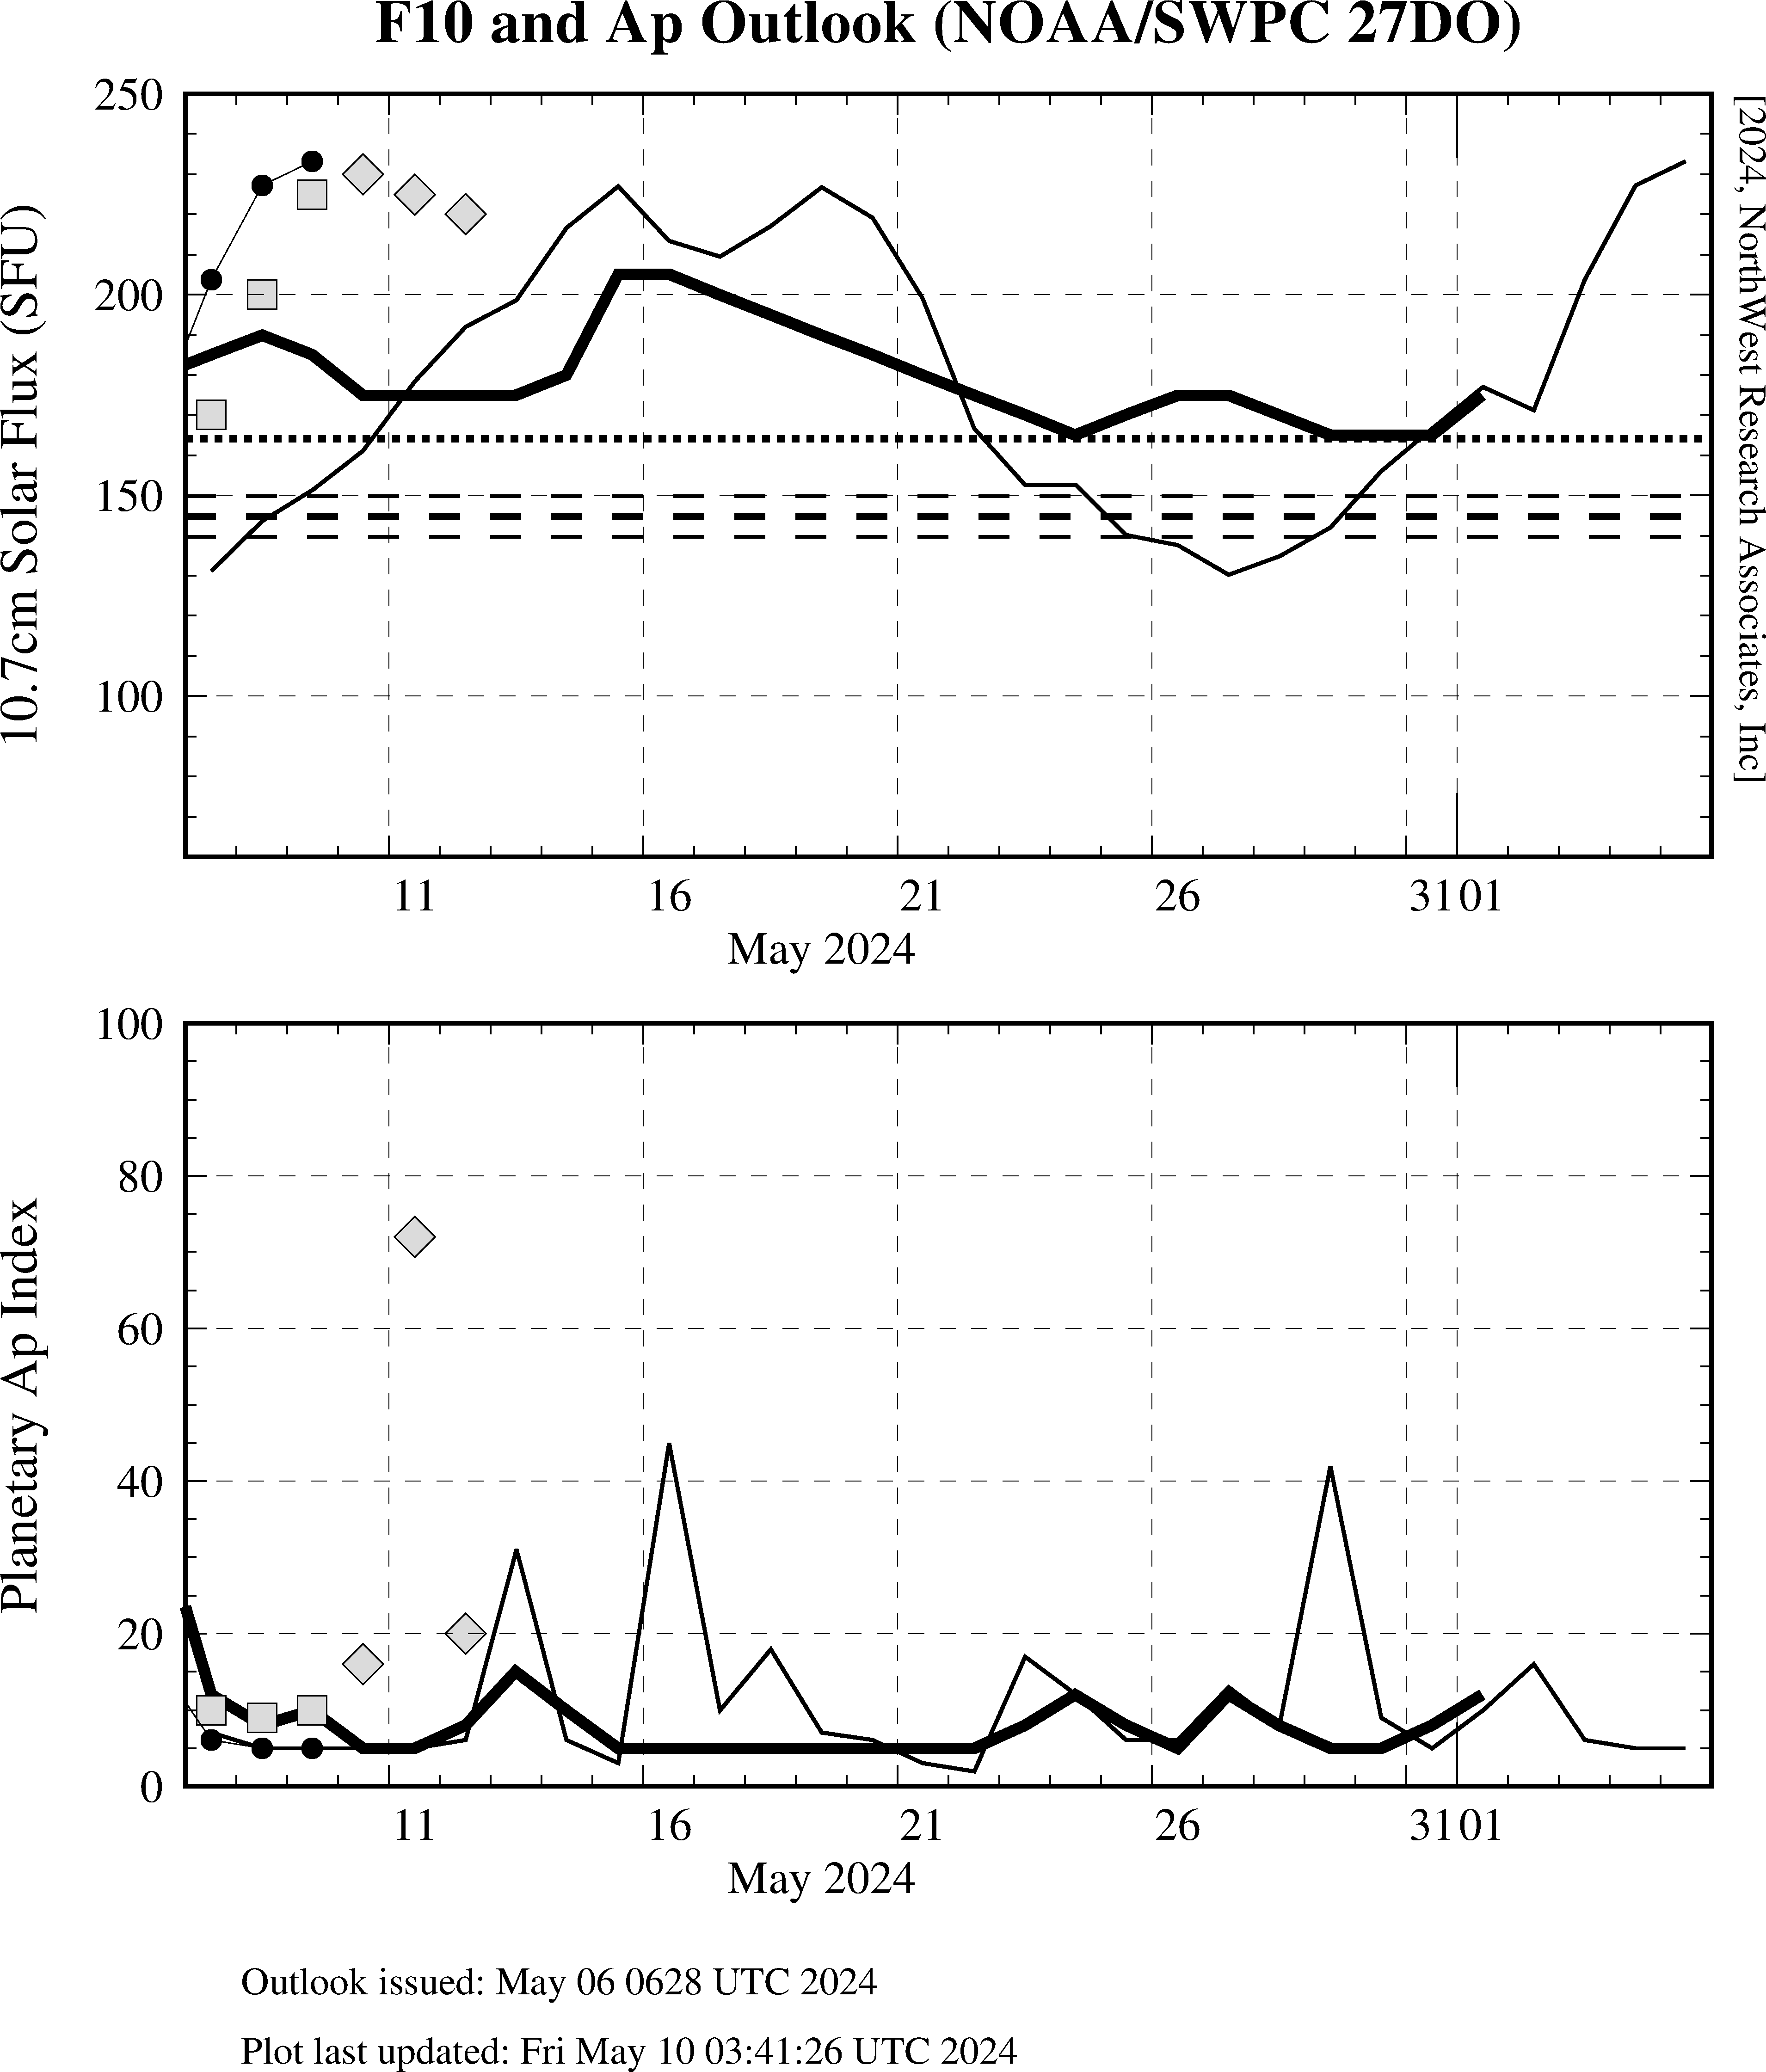 Plots of NOAA/SWPC 27-day F10 and Ap Forecasts
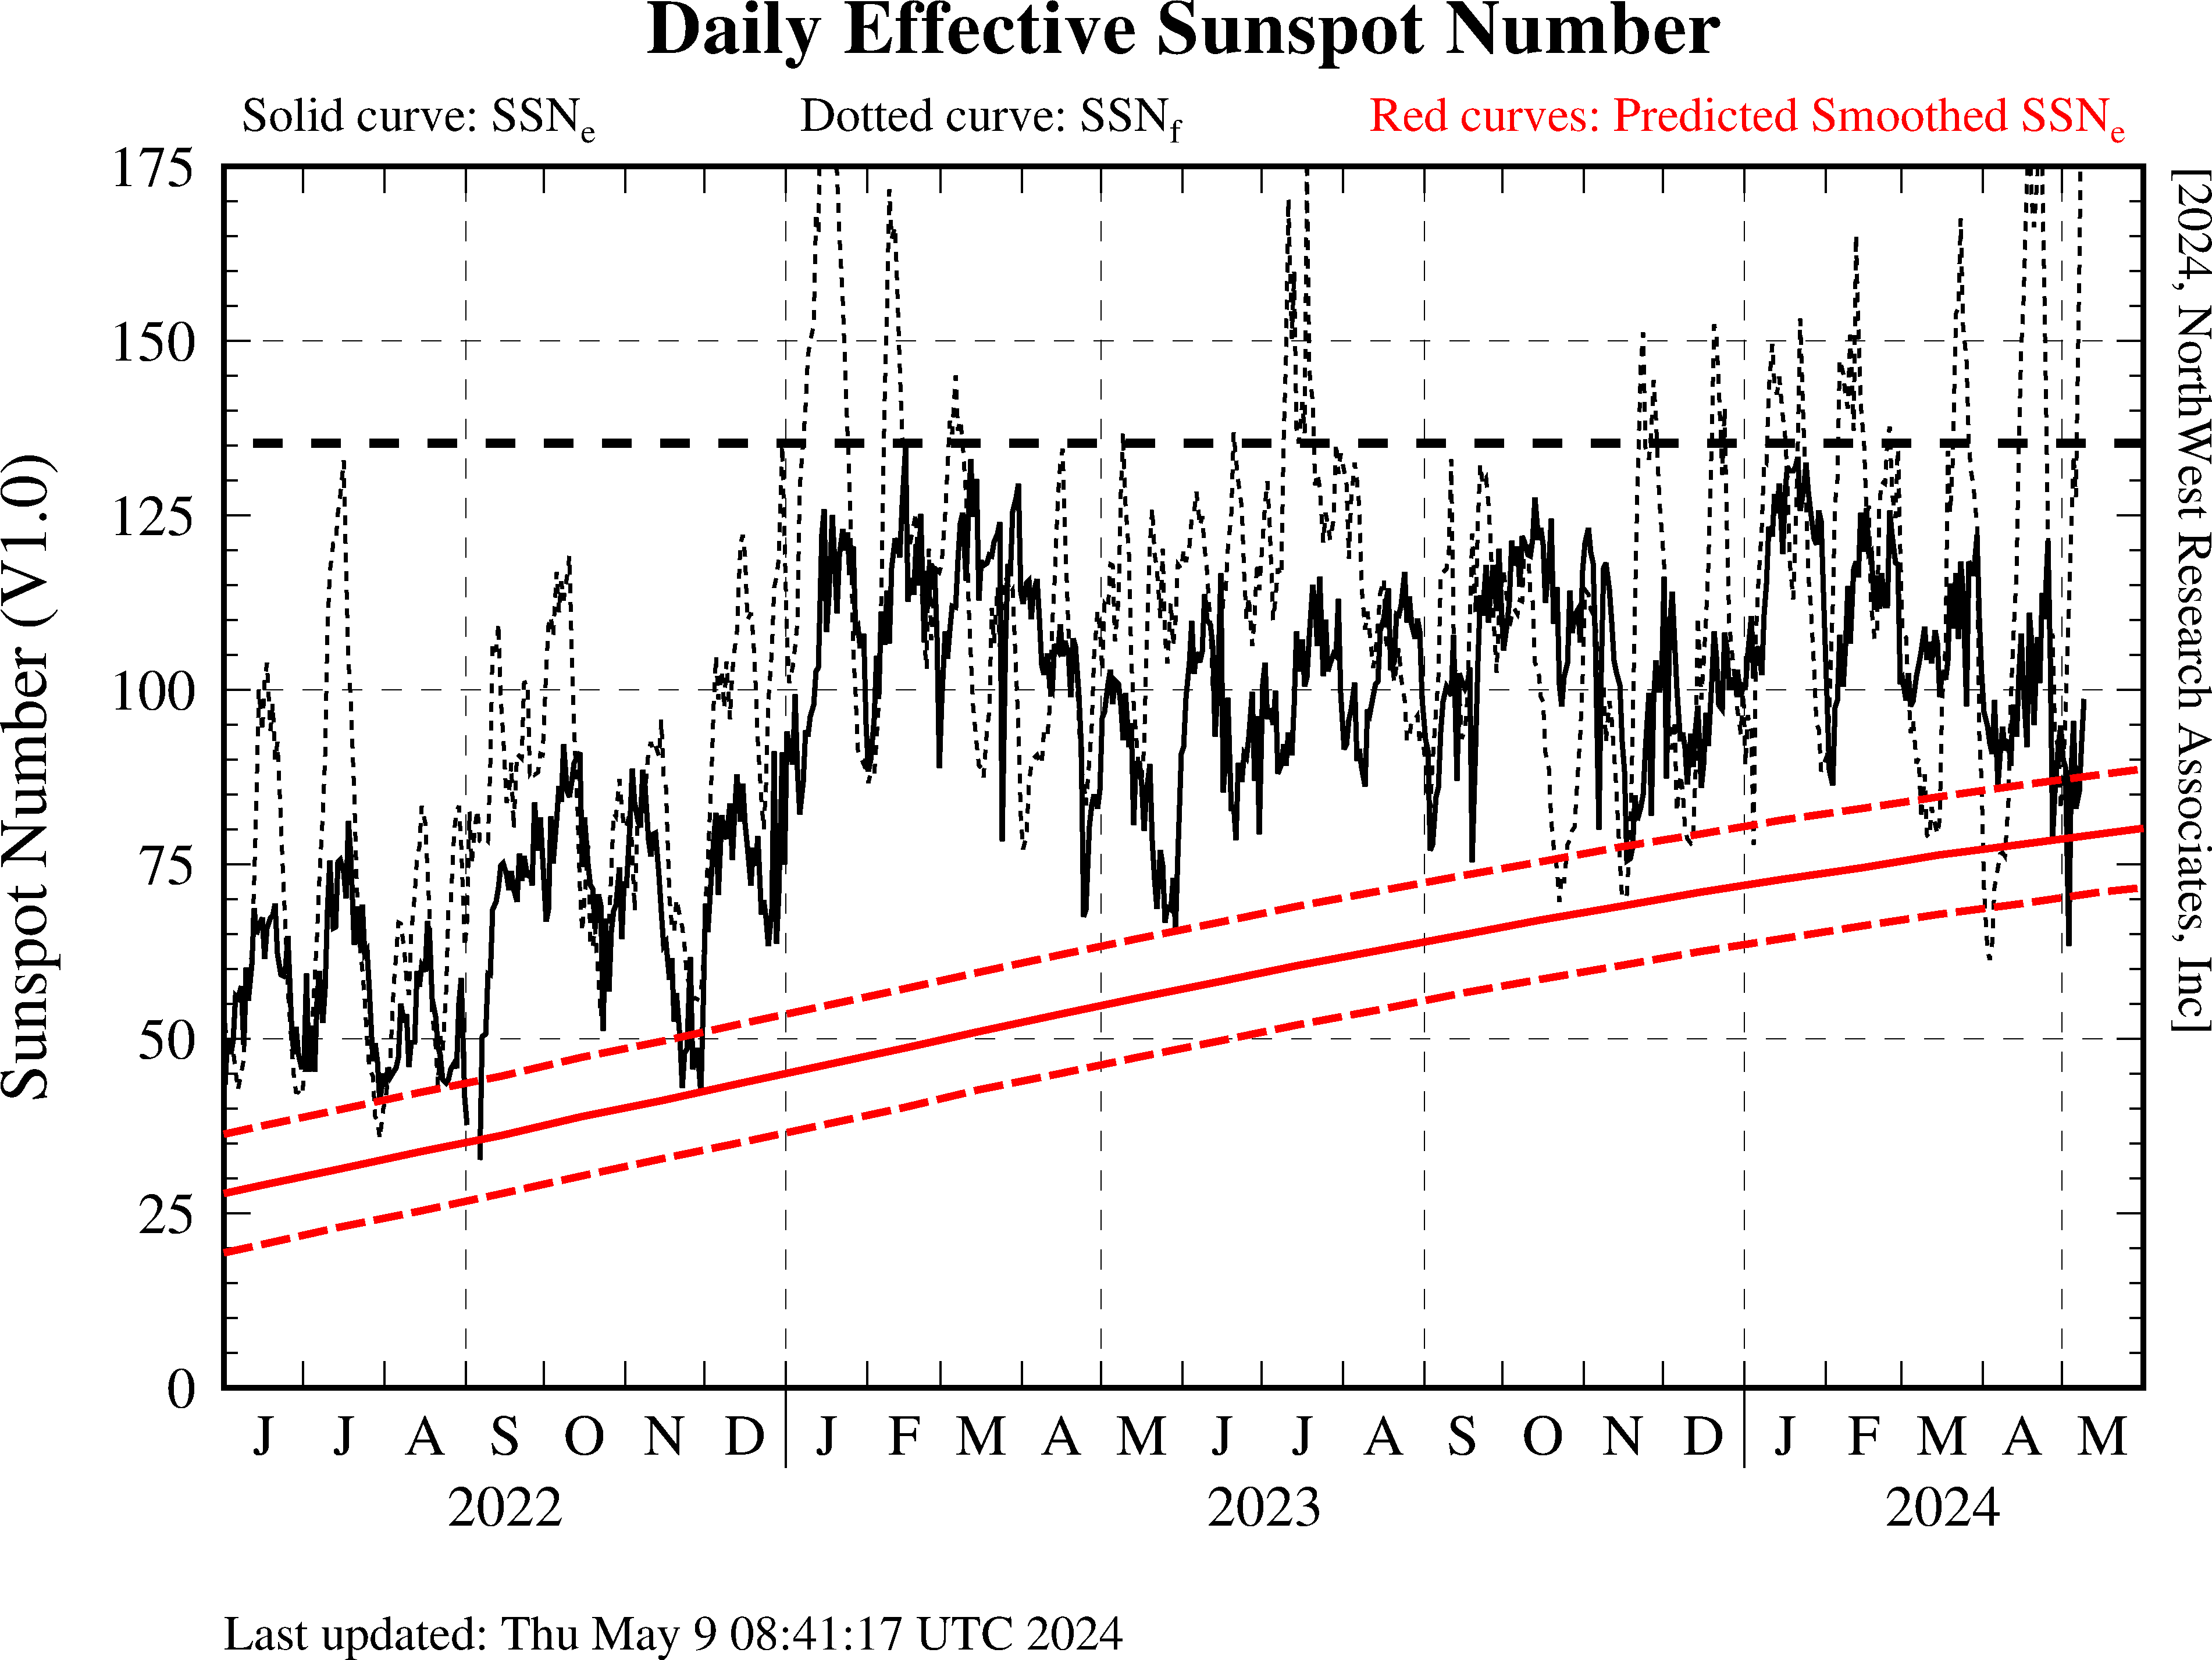 Track the status of the solar-cycle: one year of SSNe
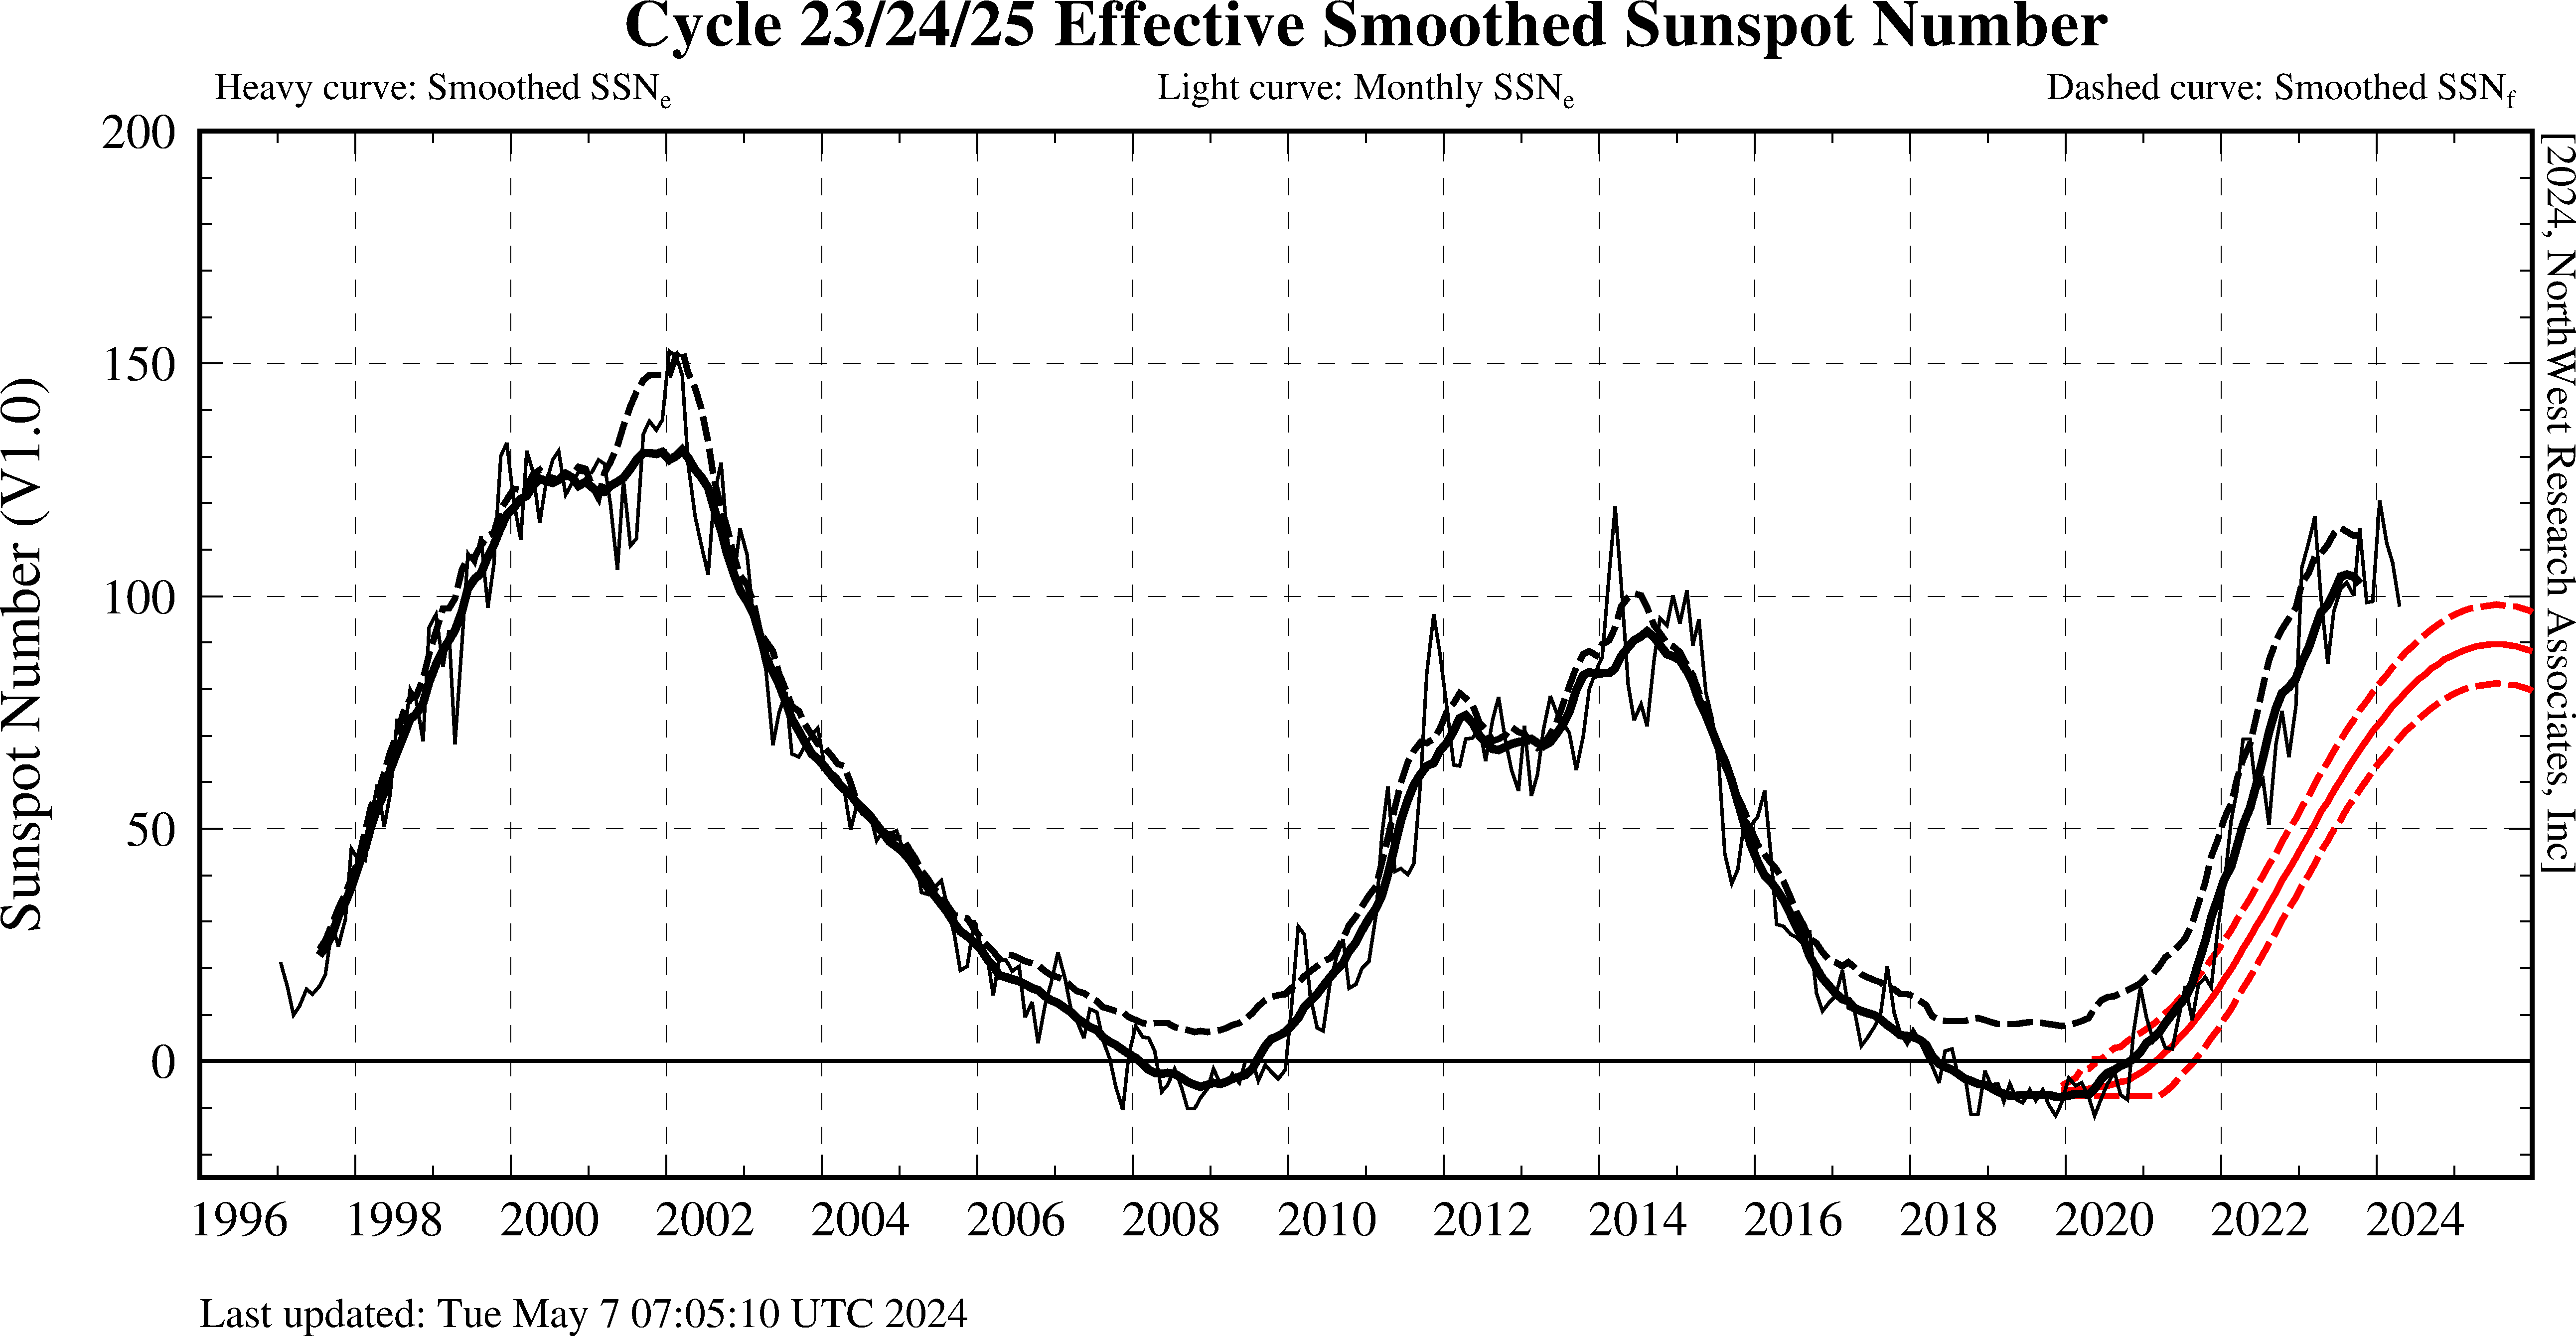 Cycles 23-25 Effective Sunspot Number plot.
The data shown in these plots came from the following sources:
If you would like to get a feel for how effective these effective-SSN indices are, foF2 plots comparing the observations with model foF2 values calculated using the NWRA SSNE and SWS T values are available. There is a one-day delay between the latest SSNe values available and these plots to permit more data to arrive at the NOAA NCEI for comparison.
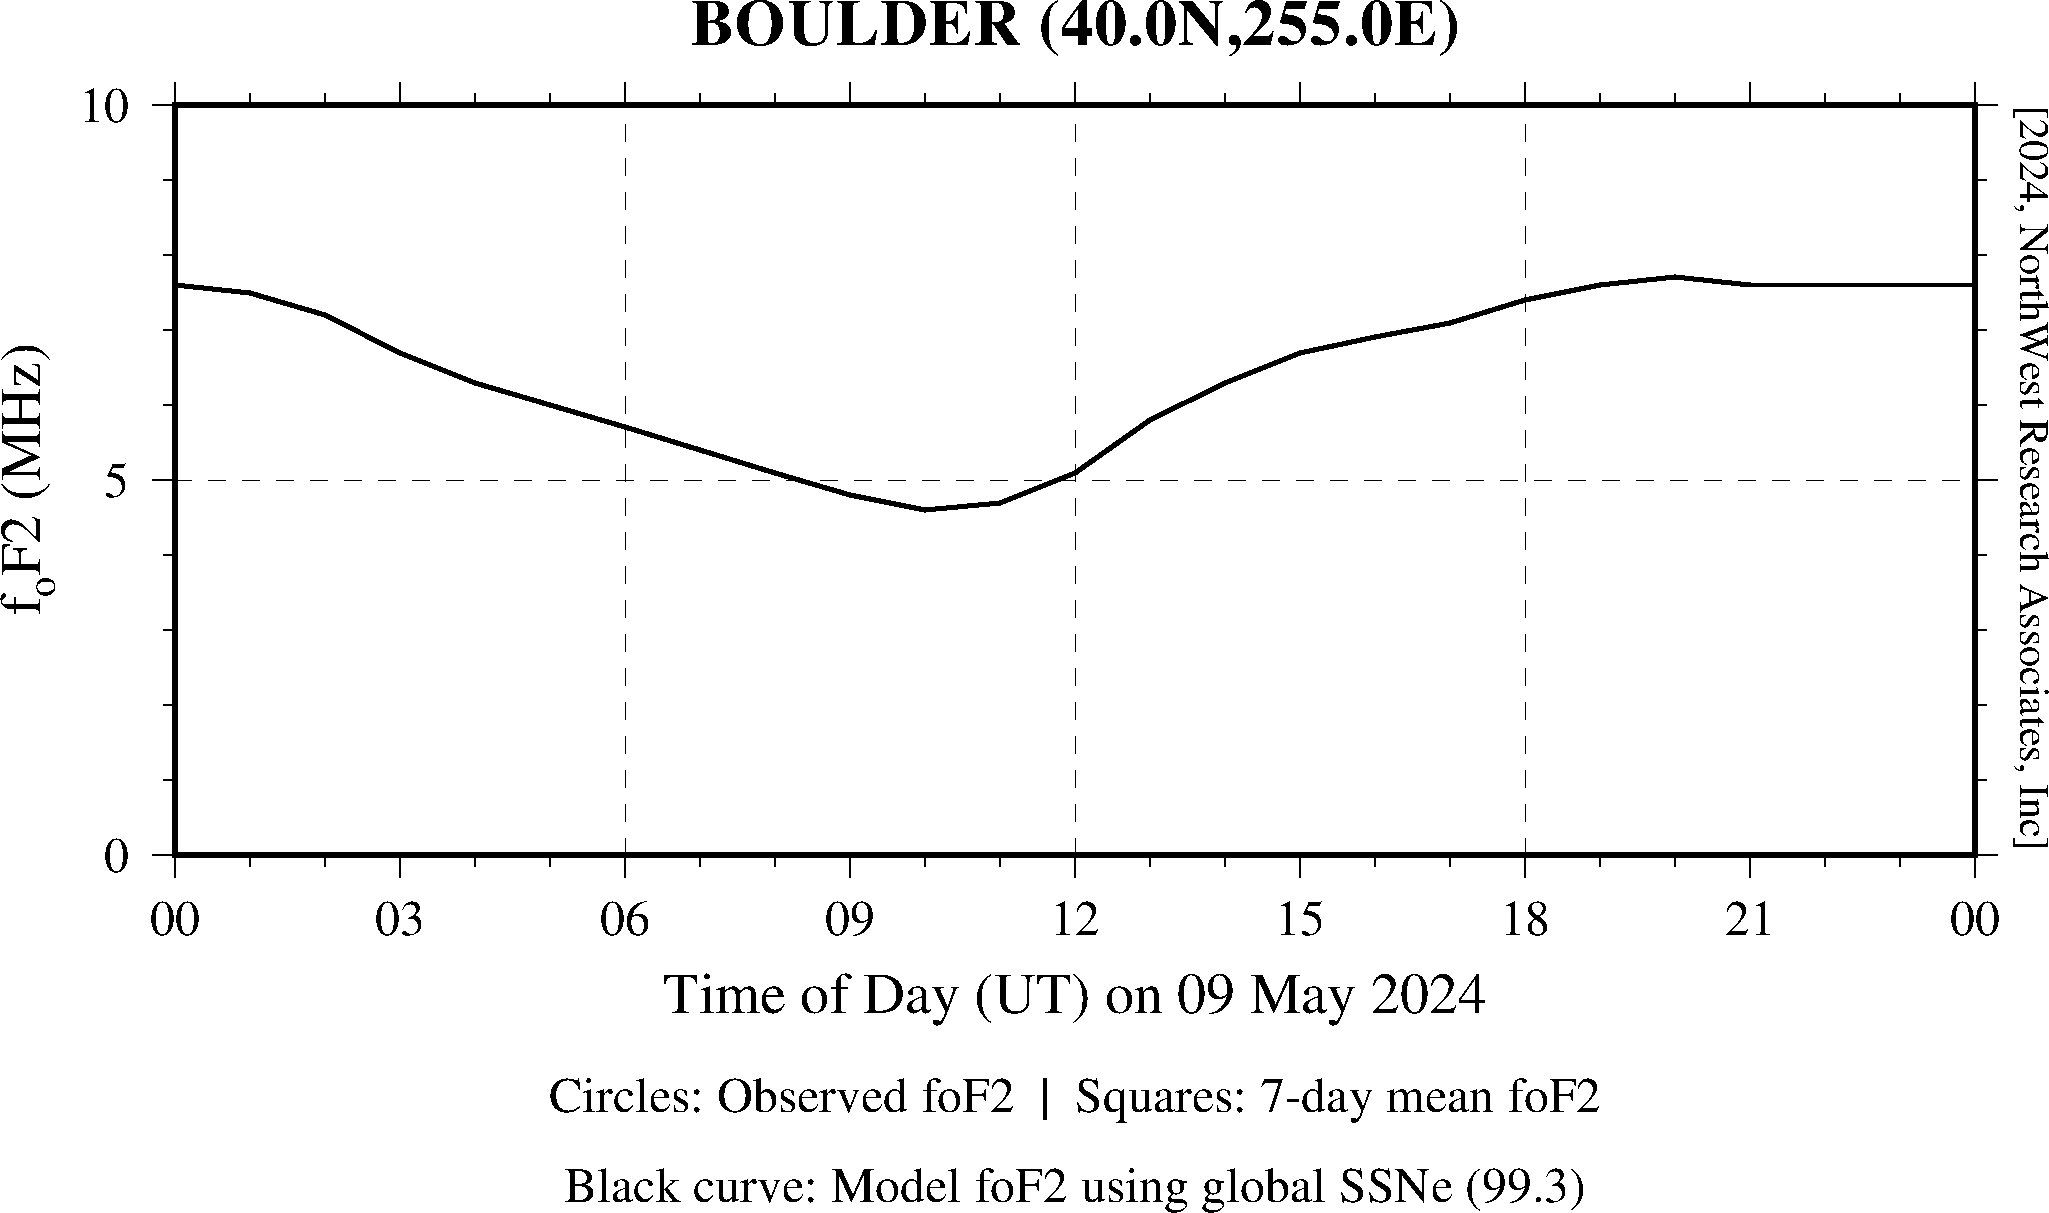 Daily foF2 Comparison Plots
If you are interested in further information regarding ionospheric radio propagation, the Radio Society of Great Britain Propagation Studies Committee has a large collection of links to things propagational.
![]()

Copyright © 1996-2024 NorthWest Research Associates, Inc. All rights reserved.